
Page 254 - Profiles's Unit Trusts & Collective Investments - September 2024
P. 254
Camissa Balanced Fund
Camissa Balanced Fund
Camissa Balanced Fund
Sector: South African—Multi Asset—
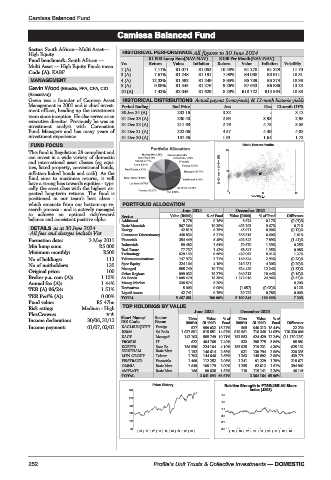
High Equity HISTORICAL PERFORMANCE All figures to 30 June 2024
Fund benchmark: South African — R1 000 Lump Sum(NAV-NAV) R100 Per Month(NAV-NAV)
Multi Asset — High Equity Funds mean Yrs Return Value Inflation Return Value Inflation Volatility
Code (A): KABF 1 (A) 7.11% R1 071 R1 052 10.48% R1 270 R1 229 11.70
3 (A) 7.67% R1 248 R1 191 7.98% R4 080 R3 911 10.31
MANAGEMENT 4 (A) 12.33% R1 592 R1 249 8.95% R5 789 R5 374 10.36
5 (A) 9.09% R1 545 R1 276 9.26% R7 653 R6 886 13.23
Gavin Wood (BBusSc, FFA, CFA, CIO
10 (A) 7.42% R2 045 R1 629 8.29% R18 722 R15 564 10.88
(Executive))
Gavin was a founder of Camissa Asset HISTORICAL DISTRIBUTIONS Actual payout (cents/unit) & 12-mnth historic yields
Management in 2001 and is chief invest- Period Ending End Price Jun Dec 12-mnth DY%
ment officer, heading up the investment 30 Jun 24 (A) 232.16 3.32 - 3.12
team since inception. He also serves as an
executive director. Previously he was an 31 Dec 23 (A) 230.40 2.93 3.93 2.98
investment analyst with Coronation 31 Dec 22 (A) 211.69 2.76 4.75 3.55
Fund Managers and has many years of 31 Dec 21 (A) 222.06 4.57 4.49 4.08
investment experience. 31 Dec 20 (A) 187.56 1.61 1.64 1.73
FUND FOCUS Risk / Return Profile
This fund is Regulation 28 compliant and 20
can invest in a wide variety of domestic
and international asset classes (eg equi-
ties, listed property, conventional bonds, 3yr Compound return(%)
inflation-linked bonds and cash). As the 10
fund aims to maximise returns, it will
have a strong bias towards equities - typi-
cally the asset class with the highest ex-
pected long-term returns. The fund is 0 0 11 22
positioned in our team’s best ideas - Volatility p.a.
which emanate from our bottom-up re- PORTFOLIO ALLOCATION
search process - and is actively managed June 2024 December 2023
to achieve an optimal risk/reward Sector Value (R000) % of Fund Value (R000) % of Fund Difference
balance and consistent positive alpha. Additional 8 778 0.16% 8 674 0.17% (0.01)%
0.71%
DETAILS as at 30 June 2024 Basic Materials 567 364 10.38% 493 293 9.67% (0.12)%
42 819
Energy
45 971
0.90%
0.78%
All fees and charges include Vat Consumer Discretionary 448 833 8.21% 336 815 6.60% 1.61%
Formation date: 3 May 2011 Financials 354 449 6.48% 402 542 7.89% (1.41)%
Min lump sum: R5 000 Industrials 89 482 1.64% 70 670 1.39% 0.25%
68 647
77 737
1.42%
Real Estate
0.08%
1.35%
Minimum monthly: R500 Technology 529 133 9.68% 429 053 8.41% 1.27%
No of holdings: 113 Telecommunications 147 973 2.71% 149 644 2.93% (0.23)%
No of unitholders: 135 Spec Equity 224 164 4.10% 219 231 4.30% (0.20)%
Original price: 100 Managed 585 749 10.71% 624 429 12.24% (1.53)%
18.27%
999 032
940 313
(0.16)%
18.44%
Other Regions
Broker p.a. com (A): 1.15% SA Bonds 1 005 470 18.39% 1 272 918 24.96% (6.57)%
Annual fee (A): 1.44% Money Market 338 874 6.20% 6.20%
Derivatives 5 003 0.09% (1 657) (0.03)% 0.12%
TER (A) 06/24: 1.51% Liquid Assets 42 741 0.78% 39 722 0.78% 0.00%
TER Perf% (A): 0.00% TOTAL 5 467 681 100.00% 5 100 346 100.00% 7.20%
Fund value: R5.47bn
TOP HOLDINGS BY VALUE
Risk rating: Medium - High
June 2024 December 2023
PlexCrowns: Short Name/ Sector
Units
%of
Value
Value
Units
%of
Income declaration: 30/06, 31/12 JSE Code Name (000’s) (R ‘000) Fund (000’s) (R ‘000) Fund Difference
Income payment: 01/07, 02/01 KAGLBLEQUITY Foreign 527 999 032 18.27% 505 940 313 18.44% 22 230
R2044 SA Bnds 1 037 891 815 851 14.92% 919 561 716 348 14.05% 118 330 000
KAGF Managed 142 103 585 749 10.71% 153 853 624 429 12.24% (11 750 225)
PROSUS IT 622 404 768 7.40% 533 298 775 5.86% 88 981
KGEFFB Spec Eq 156 550 224 164 4.10% 155 925 219 231 4.30% 625 132
NORTHAM Basic Mats 1 152 146 614 2.68% 931 130 794 2.56% 220 335
MTN GROUP Telcom 1 703 144 646 2.65% 1 263 145 892 2.86% 439 778
FIRSTRAND Financials 1 460 112 252 2.05% 1 241 91 229 1.79% 218 671
OMNIA Basic Mats 1 649 109 179 2.00% 1 255 82 012 1.61% 394 902
AMPLATS Basic Mats 166 99 638 1.82% 119 115 141 2.26% 46 148
TOTAL 3 641 893 66.61% 3 364 164 65.96%
Price History Relative Strength to FTSE/JSE All Share
240 index (J203)
1.5
210
1.3
180
1.1
150
0.9
120 0.7
90 0.5
| 15 | 16 | 17 | 18 | 19 | 20 | 21 | 22 | 23 | |15 | 16 |17 | 18 |19 | 20 |21 | 22 |23 |
252 Profile’s Unit Trusts & Collective Investments — DOMESTIC