
Page 258 - Profiles's Unit Trusts & Collective Investments - September 2024
P. 258
Camissa Islamic Equity Fund
Camissa Islamic Equity Fund
Camissa Islamic Equity Fund
Sector: South African—Equity—General
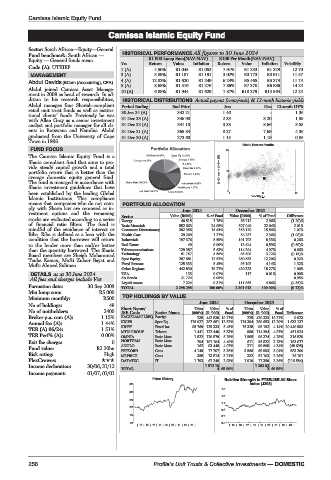
Fund benchmark: South African — HISTORICAL PERFORMANCE All figures to 30 June 2024
Equity — General funds mean R1 000 Lump Sum(NAV-NAV) R100 Per Month(NAV-NAV)
Code (A): UTKIEF Yrs Return Value Inflation Return Value Inflation Volatility
1 (A) 4.50% R1 045 R1 052 7.91% R1 253 R1 229 12.70
MANAGEMENT 3 (A) 5.89% R1 187 R1 191 3.02% R3 773 R3 911 11.57
4 (A) 12.82% R1 620 R1 249 6.24% R5 465 R5 374 11.74
Abdul Davids (BCom (Accounting), CFA)
R7 370
R6 886
Abdul joined Camissa Asset Manage- 5 (A) 8.68% R1 516 R1 276 7.86% R18 279 R15 564 14.24
12.24
R1 944
R1 629
7.87%
6.88%
10 (A)
ment in 2008 as head of research. In ad-
dition to his research responsibilities, HISTORICAL DISTRIBUTIONS Actual payout (cents/unit) & 12-mnth historic yields
Abdul manages four Shariah-compliant Period Ending End Price Jun Dec 12-mnth DY%
retail unit trust funds as well as institu-
tional clients’ funds. Previously he was 30 Jun 24 (A) 342.21 1.46 - 1.36
with Allan Gray as a senior investment 31 Dec 23 (A) 346.98 2.33 3.20 1.59
analyst and portfolio manager for all cli- 31 Dec 22 (A) 341.10 3.38 8.66 3.53
ents in Botswana and Namibia. Abdul 31 Dec 21 (A) 365.84 8.27 7.69 4.36
graduated from the University of Cape 31 Dec 20 (A) 273.60 1.15 1.19 0.86
Town in 1996.
Risk / Return Profile
FUND FOCUS 20
The Camissa Islamic Equity Fund is a
Sharia compliant fund that aims to pro-
vide steady capital growth and a total 3yr Compound return(%)
portfolio return that is better than the 10
average domestic equity general fund.
The fund is managed in accordance with
Sharia investment guidelines that have
been established by the leading Global 0 0 11 22
Islamic Institutions. This compliance Volatility p.a.
means that companies who do not com- PORTFOLIO ALLOCATION
ply with Sharia law are removed as in- June 2024 December 2023
vestment options and the remaining Sector
stocks are evaluated according to a series Energy Value (R000) % of Fund Value (R000) % of Fund Difference
68 212
2.96%
(1.20)%
40 515
1.76%
of financial ratio filters. The fund is Basic Materials 552 663 24.05% 507 049 22.04% 2.01%
mindful of the avoidance of interest or Consumer Discretionary 382 356 16.64% 358 120 15.56% 1.07%
Riba. Riba is defined as a loan with the Health Care 29 269 1.27% 54 237 2.36% (1.08)%
condition that the borrower will return Industrials 197 376 8.59% 191 702 8.33% 0.26%
to the lender more than and/or better Real Estate 49 0.00% 13 644 0.59% (0.59)%
than the quantity borrowed. The Sharia Telecommunications 129 387 5.63% 114 294 4.97% 0.66%
Board members are Sheigh Mohammad Technology 81 757 3.56% 85 605 3.72% (0.16)%
Tauha Karaan, Mufti Zubair Bayat and Spec Equity 287 681 12.52% 280 653 12.20% 0.32%
Mufti Ahmed Suliman. Fixed Interest 125 333 5.45% 95 192 4.14% 1.32%
Other Regions 442 830 19.27% 420 333 18.27% 1.00%
DETAILS as at 30 June 2024 USA 133 0.01% 117 0.01% 0.00%
All fees and charges include Vat SA Bonds 21 724 0.95% 0.95%
Liquid Assets 7 224 0.31% 111 855 4.86% (4.55)%
Formation date: 30 Sep 2009 TOTAL 2 298 298 100.00% 2 301 013 100.00% (0.12)%
Min lump sum: R5 000 TOP HOLDINGS BY VALUE
Minimum monthly: R500
June 2024 December 2023
No of holdings: 48
Short Name/ Units Value %of Units Value %of
No of unitholders: 2400 JSE Code Sector Name (000’s) (R ‘000) Fund (000’s) (R ‘000) Fund Difference
Broker p.a. com (A): 1.15% KAGISLAMGLBEQ Foreign 235 442 830 19.27% 225 420 333 18.27% 9 923
Annual fee (A): 1.44% KIGFB Spec Eq 176 027 287 681 12.52% 174 394 280 653 12.20% 1 633 137
KIHYF Fixed Int 95 769 125 333 5.45% 75 328 95 192 4.14% 20 440 993
TER (A) 06/24: 1.51% MTN GROUP Telcom 1 441 122 440 5.33% 990 114 294 4.97% 451 924
TER Perf% (A): 0.00% OMNIA Basic Mats 1 822 120 579 5.25% 1 505 98 374 4.28% 316 829
Exit fee charge: 0 NORTHAM Basic Mats 794 101 104 4.40% 611 85 822 3.73% 183 077
211
162
Fund value: R2.30bn ANGLO Basic Mats 4 149 93 448 4.07% 3 566 99 808 4.34% (48 698)
77 707
583 200
PEPKORH
3.04%
Cons
3.38%
69 993
Risk rating: High MRPRICE Cons 358 73 814 3.21% 332 52 103 2.26% 26 191
PlexCrowns: DATATEC IT 1 793 67 248 2.93% 1 910 77 350 3.36% (116 584)
Income declaration: 30/06, 31/12 TOTAL 1 512 18 4 65.80% 1 393 92 2 60.58%
Income payment: 01/07, 01/01
Price History Relative Strength to FTSE/JSE All Share
370 index (J203)
1.5
316
1.3
262
1.1
208
0.9
154 0.7
100 0.5
| 15 | 16 | 17 | 18 | 19 | 20 | 21 | 22 | 23 | |15 | 16 |17 | 18 |19 | 20 |21 | 22 |23 |
256 Profile’s Unit Trusts & Collective Investments — DOMESTIC