
Page 262 - Profiles's Unit Trusts & Collective Investments - September 2024
P. 262
Camissa SA Balanced Fund
Camissa SA Balanced Fund
Camissa SA Balanced Fund
Sector: South African—Multi Asset—
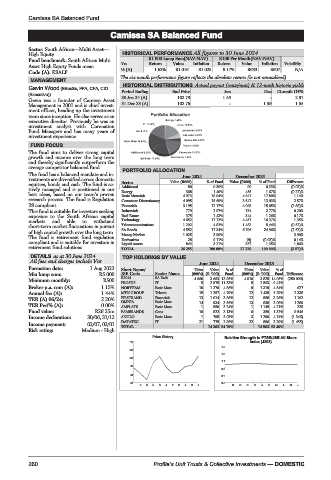
High Equity HISTORICAL PERFORMANCE All figures to 30 June 2024
Fund benchmark: South African Multi R1 000 Lump Sum(NAV-NAV) R100 Per Month(NAV-NAV)
Asset High Equity Funds mean Yrs Return Value Inflation Return Value Inflation Volatility
Code (A): KSALF ½ (A) 1.62% R1 016 R1 025 9.17% R633 R607 N/A
The six month performance figure reflects the absolute return (is not annualised).
MANAGEMENT
HISTORICAL DISTRIBUTIONS Actual payout (cents/unit) & 12-mnth historic yields
Gavin Wood (BBusSc, FFA, CFA, CIO
Period Ending End Price Jun Dec 12-mnth DY%
(Executive)) 30 Jun 24 (A) 102.79 1.46 - 2.97
Gavin was a founder of Camissa Asset
Management in 2001 and is chief invest- 31 Dec 23 (A) 102.76 - 1.59 1.55
ment officer, heading up the investment
team since inception. He also serves as an
executive director. Previously he was an
investment analyst with Coronation
Fund Managers and has many years of
investment experience.
FUND FOCUS
The fund aims to deliver strong capital
growth and income over the long term
and thereby significantly outperform the
average competitor balanced fund. PORTFOLIO ALLOCATION
The fund has a balanced mandate and in- June 2024 December 2023
vestments are diversified across domestic
equities, bonds and cash. The fund is ac- Sector Value (R000) % of Fund Value (R000) % of Fund Difference
tively managed and is positioned in our Additional 80 0.30% 90 0.33% (0.03)%
1.40%
455
368
1.67%
best ideas, based on our team’s proven Energy 4 973 18.94% 4 847 17.80% (0.27)%
Basic Materials
1.14%
research process. The fund is Regulation Consumer Discretionary 4 095 15.60% 3 547 13.03% 2.57%
28 compliant. Financials 3 195 12.17% 4 098 15.05% (2.88)%
This fund is suitable for investors seeking Industrials 779 2.97% 754 2.77% 0.20%
exposure to the South African capital Real Estate 375 1.43% 344 1.26% 0.17%
markets and able to withstand Technology 4 652 17.72% 4 457 16.37% 1.35%
short-term market fluctuations in pursuit Telecommunications 1 292 4.92% 1 482 5.44% (0.52)%
of high capital growth over the long term. SA Bonds 4 552 17.34% 6 796 24.96% (7.62)%
The fund is retirement fund regulation Money Market 1 025 3.90% 3.90%
28
(9)
compliant and is suitable for investors in Derivatives 843 0.11% 367 (0.03)% 0.14%
1.86%
3.21%
1.35%
Liquid Assets
retirement fund solutions. TOTAL 26 255 100.00% 27 228 100.00% (3.57)%
DETAILS as at 30 June 2024 TOP HOLDINGS BY VALUE
All fees and charges include Vat June 2024 December 2023
Formation date: 1 Aug 2023 Short Name/ Units Value %of Units Value %of
Min lump sum: R5 000 JSE Code Sector Name (000’s) (R ‘000) Fund (000’s) (R ‘000) Fund Difference
R2044 SA Bnds 4 660 3 663 13.95% 4 910 3 825 14.05% (250 000)
Minimum monthly: R500 PROSUS IT 5 2 975 11.33% 5 2 563 9.41% -
Broker p.a. com (A): 1.15% NORTHAM Basic Mats 10 1 276 4.86% 9 1 319 4.84% 627
Annual fee (A): 1.44% MTN GROUP Telcom 15 1 257 4.79% 12 1 439 5.29% 2 338
FIRSTRAND Financials 13 1 014 3.86% 12 888 3.26% 1 102
TER (A) 06/24: 2.20%
OMNIA Basic Mats 14 934 3.56% 13 838 3.08% 1 289
TER Perf% (A): 0.00% AMPLATS Basic Mats 1 850 3.24% 1 1 145 4.21% 225
Fund value: R26.25m FAMBRANDS Cons 16 822 3.13% 6 359 1.32% 9 546
Income declaration: 30/06, 31/12 ANGLO Basic Mats 1 795 3.03% 3 1 290 4.74% (1 346)
IT
DATATEC
896
775
2.95%
3.29%
Income payment: 02/07, 02/01 TOTAL 21 14 362 54.70% 22 14 563 53.49% (1 455)
Risk rating: Medium - High
Price History Relative Strength to FTSE/JSE All Share
110 index (J203)
1.5
106
1.3
102
1.1
98
0.9
94 0.7
90 0.5
S O N D J F M A M J S O N D J F M A M J
260 Profile’s Unit Trusts & Collective Investments — DOMESTIC