
Page 264 - Profiles's Unit Trusts & Collective Investments - September 2024
P. 264
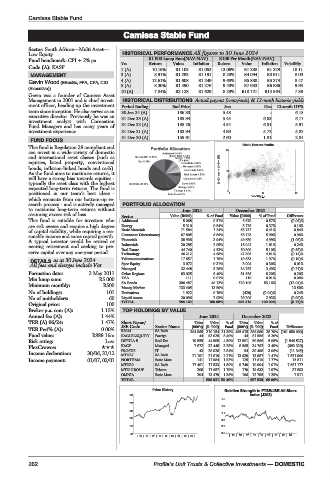
Camissa Stable Fund

                                    Camissa Stable Fund
         Camissa Stable Fund
         Sector: South African—Multi Asset—
         Low Equity                 HISTORICAL PERFORMANCE All figures to 30 June 2024
         Fund benchmark:CPI+2%pa           R1 000 Lump Sum(NAV-NAV)  R100 Per Month(NAV-NAV)
         Code (A): KASF            Yrs     Return  Value  Inflation  Return  Value  Inflation  Volatility
                                   1 (A)    10.16%  R1 102  R1 052  13.06%  R1 288  R1 229  10.11
          MANAGEMENT               3 (A)     8.91%  R1 292  R1 191  8.20%  R4 094  R3 911  8.09
                                   4 (A)    12.61%  R1 608  R1 249  9.68%  R5 880  R5 374  8.47
         Gavin Wood (BBusSc, FFA, CFA, CIO
                                   5 (A)     8.30%  R1 490  R1 276  9.40%  R7 683  R6 886  9.93
         (Executive))
                                   10 (A)    7.84%  R2 128  R1 629  8.29%  R18 721  R15 564  7.86
         Gavin was a founder of Camissa Asset
         Management in 2001 and is chief invest-  HISTORICAL DISTRIBUTIONS Actual payout (cents/unit) & 12-mnth historic yields
         ment officer, heading up the investment  Period Ending  End Price  Jun  Dec  12-mnth DY%
         team since inception. He also serves as an  30 Jun 24 (A)  186.30  5.48  -  6.18
         executive director. Previously he was an
         investment  analyst  with Coronation  31 Dec 23 (A)  185.94  5.45  6.03     6.17
         Fund Managers and has many years of  31 Dec 22 (A)  185.26  4.54  6.51      5.97
         investment experience.    31 Dec 21 (A)   183.94       4.99       5.72      5.82
                                   31 Dec 20 (A)   155.61       2.60       1.81      2.84
          FUND FOCUS
         This fund is Regulation 28 compliant and                     Risk / Return Profile
         can invest in a wide variety of domestic                20
         and international asset classes (such as
         equities, listed property, conventional
         bonds, inflation-linked bonds and cash).              3yr Compound return(%)
         As the fund aims to maximise returns, it                10
         will have a strong bias towards equities -
         typically the asset class with the highest
         expected long-term returns. The fund is
         positioned in our team’s best ideas -                   0 0       11       22
         which emanate from our bottom-up re-                           Volatility p.a.
         search process - and is actively managed  PORTFOLIO ALLOCATION
         to maximise long-term returns without       June 2024      December 2023
         assuming excess risk of loss.  Sector   Value (R000)  % of Fund  Value (R000)  % of Fund  Difference
         This fund is suitable for investors who  Additional  5 068  0.51%  5 670  0.57%  (0.06)%
         are risk averse and require a high degree  Energy  5 310  0.54%  3 728  0.37%  0.16%
         of capital stability, while requiring a rea-  Basic Materials  71 584  7.24%  63 757  6.41%  0.84%
         sonable income and some capital growth.  Consumer Discretionary  67 805  6.86%  58 723  5.90%  0.96%
         A typical investor would be retired or  Financials  38 938  3.94%  49 680  4.99%  (1.05)%
         nearing retirement and seeking to pre-  Industrials  20 285  2.05%  18 041  1.81%  0.24%
         serve capital over any one-year period.  Real Estate  44 740  4.53%  50 800  5.10%  (0.58)%
                                   Technology       46 212   4.68%   47 895  4.81%  (0.14)%
          DETAILS as at 30 June 2024  Telecommunications  17 657  1.79%  19 633  1.97%  (0.19)%
          All fees and charges include Vat  Spec Equity  3 072  0.31%  3 004  0.30%  0.01%
                                   Managed          32 448   3.28%   34 762  3.49%  (0.21)%
         Formation date:  3 May 2011  Other Regions  83 025  8.40%   81 586  8.20%  0.20%
         Min lump sum:       R5 000  USA              111    0.01%    110   0.01%   0.00%
         Minimum monthly:     R500  SA Bonds        396 487  40.12%  529 106  53.16%  (13.04)%
                                                             13.50%
                                                                                    13.50%
                                   Money Market
                                                    133 405
         No of holdings:       101  Derivatives      1 922   0.19%    (420)  (0.04)%  0.24%
         No of unitholders:     60  Liquid Assets   20 096   2.03%   29 206  2.93%  (0.90)%
         Original price:       100  TOTAL          988 163  100.00%  995 319  100.00%  (0.72)%
         Broker p.a. com (A):  1.15%  TOP HOLDINGS BY VALUE
         Annual fee (A):      1.44%                      June 2024   December 2023
         TER (A) 06/24:       1.47%  Short Name/        Units  Value  %of  Units  Value  %of
                                   JSE Code  Sector Name  (000’s) (R ‘000)  Fund  (000’s) (R ‘000)  Fund  Difference
         TER Perf% (A):       0.00%
                                   R2044     SA Bnds   394 565 310 154 31.39% 495 615 386 089 38.79% (101 050 000)
         Fund value:       R988.16m  KAGLBLEQUITY  Foreign  44  83 025  8.40%  44  81 586  8.20%  -
         Risk rating:          Low  DIPULA B  Real Est  10 855  44 505  4.50%  12 801  50 566  5.08%  (1 946 527)
         PlexCrowns:               KAGF      Managed    7 872  32 448  3.28%  8 565  34 762  3.49%  (693 320)
         Income declaration:  30/06, 31/12  PROSUS  IT   43  28 026  2.84%  54  30 498  3.06%  (11 345)
                                   MTN27     SA Bnds   21 191  21 819  2.21%  13 639  13 987  1.41%  7 551 900
         Income payment:  01/07, 02/01  NORTHAM  Basic Mats  141  17 984  1.82%  125  17 619  1.77%  15 811
                                   MTN30     SA Bnds   17 401  17 833  1.80%  9 740  10 004  1.01%  7 661 177
                                   MTN GROUP  Telcom     208  17 657  1.79%  170  19 633  1.97%  37 893
                                   OMNIA     Basic Mats  204  13 479  1.36%  196  12 795  1.29%  7 911
                                   TOTAL                   586 931 59.40%  657 539 66.06%
                                            Price History       Relative Strength to FTSE/JSE All Share
                                      190                              index (J203)
                                                                1.5
                                      170
                                                                1.3
                                      150
                                                                1.1
                                      130
                                                                0.9
                                      110                       0.7
                                      90                        0.5
                                        | 15 | 16 | 17 | 18 | 19 | 20 | 21 | 22 | 23 |  |15 | 16 |17 | 18 |19 | 20 |21 | 22 |23 |
         262                                Profile’s Unit Trusts & Collective Investments — DOMESTIC