
Page 255 - Profiles's Unit Trusts & Collective Investments - September 2024
P. 255
Camissa Equity Alpha Fund
Camissa Equity Alpha Fund
Camissa Equity Alpha Fund
Sector: South African—Equity—General
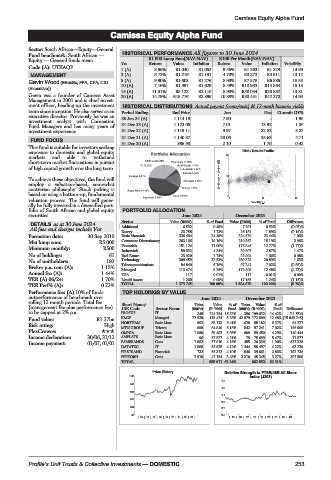
Fund benchmark: South African — HISTORICAL PERFORMANCE All figures to 30 June 2024
Equity — General funds mean R1 000 Lump Sum(NAV-NAV) R100 Per Month(NAV-NAV)
Code (A): UTKAQF Yrs Return Value Inflation Return Value Inflation Volatility
1 (A) 3.96% R1 040 R1 052 9.46% R1 263 R1 229 14.90
MANAGEMENT 3 (A) 6.72% R1 216 R1 191 4.70% R3 873 R3 911 13.12
5 (A) 9.90% R1 603 R1 276 8.90% R7 578 R6 886 18.53
Gavin Wood (BBusSc, FFA, CFA, CIO
10 (A) 7.16% R1 997 R1 629 8.49% R18 933 R15 564 15.13
(Executive))
15 (A) 11.51% R5 122 R2 116 8.98% R38 054 R26 882 13.81
Gavin was a founder of Camissa Asset 20 (A) 14.79% R15 776 R2 896 10.38% R80 451 R42 270 14.93
Management in 2001 and is chief invest-
ment officer, heading up the investment HISTORICAL DISTRIBUTIONS Actual payout (cents/unit) & 12-mnth historic yields
team since inception. He also serves as an Period Ending End Price Jun Dec 12-mnth DY%
executive director. Previously he was an 30 Jun 24 (A) 1 114.19 7.90 - 1.96
investment analyst with Coronation
Fund Managers and has many years of 31 Dec 23 (A) 1 123.06 7.01 13.92 1.86
investment experience. 31 Dec 22 (A) 1 119.11 9.97 32.82 3.82
31 Dec 21 (A) 1 140.87 28.06 25.63 4.71
FUND FOCUS
31 Dec 20 (A) 896.98 2.10 1.70 0.42
This fund is suitable for investors seeking
exposure to domestic and global equity Risk / Return Profile
markets and able to withstand 20
short-term market fluctuations in pursuit
of high capital growth over the long term.
To achieve these objectives, the fund will 3yr Compound return(%) 10
employ a valuation-based, somewhat
contrarian philosophy. Stock picking is
based on using a bottom-up, fundamental 0
11
valuation process. The fund will gener- 0 Volatility p.a. 22
ally be fully invested in a diversified port-
folio of South African and global equity PORTFOLIO ALLOCATION
securities. June 2024 December 2023
Sector Value (R000) % of Fund Value (R000) % of Fund Difference
DETAILS as at 30 June 2024 Additional 6 532 0.48% 7 291 0.53% (0.05)%
All fees and charges include Vat Energy 23 758 1.73% 26 181 1.89% (0.16)%
Formation date: 30 Sep 2010 Basic Materials 336 464 24.49% 324 520 23.44% 1.06%
3.96%
Min lump sum: R5 000 Consumer Discretionary 263 166 19.16% 210 362 15.19% (1.77)%
Financials
176 846
151 124
11.00%
12.77%
Minimum monthly: R500 Industrials 59 632 4.34% 39 807 2.87% 1.47%
No of holdings: 61 Real Estate 23 920 1.74% 22 994 1.66% 0.08%
No of unitholders: 193 Technology 309 459 22.53% 289 322 20.89% 1.63%
84 840
7.02%
97 241
Broker p.a. com (A): 1.15% Telecommunications 113 474 6.18% 172 809 12.48% (0.85)%
Managed
8.26%
(4.22)%
Annual fee (A): 1.44% USA 117 0.01% 117 0.01% 0.00%
TER (A) 06/24: 1.70% Liquid Assets 1 260 0.09% 17 185 1.24% (1.15)%
TOTAL 1 373 745 100.00% 1 384 675 100.00% (0.79)%
TER Perf% (A): 0.23%
Performance fee: (A) 10% of funds TOP HOLDINGS BY VALUE
outperformance of benchmark over June 2024 December 2023
rolling 12 month periods. Total fee Short Name/ Units Value %of Units Value %of
(management fee plus performance fee) JSE Code Sector Name (000’s) (R ‘000) Fund (000’s) (R ‘000) Fund Difference
to be capped at 2% p.a. PROSUS IT 345 224 254 16.32% 356 199 632 14.42% (11 554)
Fund value: R1.37bn KAGF Managed 27 529 113 474 8.26% 42 579 172 809 12.48% (15 049 745)
64 227
Risk rating: High NORTHAM Basic Mats 692 88 113 6.41% 628 88 182 6.37% 156 908
97 241
999
Telcom
842
6.18%
7.02%
84 840
MTN GROUP
PlexCrowns: OMNIA Basic Mats 1 050 69 492 5.06% 909 59 450 4.29% 140 444
Income declaration: 30/06, 31/12 AMPLATS Basic Mats 96 57 827 4.21% 79 75 699 5.47% 17 577
FAMBRANDS Cons 1 092 57 010 4.15% 455 26 336 1.90% 637 328
Income payment: 01/07, 01/01
DATATEC IT 1 508 56 535 4.12% 1 444 58 497 4.22% 63 229
FIRSTRAND Financials 732 56 312 4.10% 540 39 661 2.86% 192 736
PEPKORH Cons 2 518 47 154 3.43% 2 310 45 345 3.27% 207 590
TOTAL 855 011 62.24% 862 852 62.31%
Price History Relative Strength to FTSE/JSE All Share
1160 index (J203)
1.5
946
1.3
732
1.1
518
0.9
304 0.7
90 0.5 |15 | 16 |17 | 18 |19 | 20 |21 | 22 |23 |
| 15 | 16 | 17 | 18 | 19 | 20 | 21 | 22 | 23 |
Profile’s Unit Trusts & Collective Investments — DOMESTIC 253