
Page 272 - Profiles's Unit Trusts & Collective Investments - September 2024
P. 272
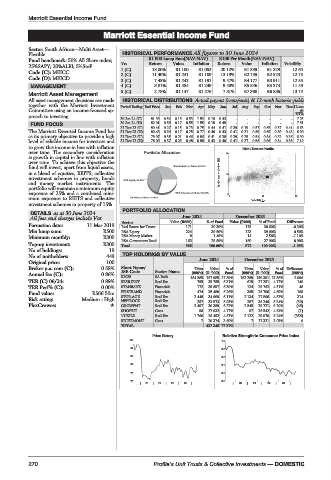
Marriott Essential Income Fund

                              Marriott Essential Income Fund
         Marriott Essential Income Fund
         Sector: South African—Multi Asset—
         Flexible                   HISTORICAL PERFORMANCE All figures to 30 June 2024
         Fund benchmark: 50% All Share index;  R1 000 Lump Sum(NAV-NAV)  R100 Per Month(NAV-NAV)
         25%SAPY; 20%ALBI; 5%SteF  Yrs     Return  Value  Inflation  Return  Value  Inflation  Volatility
         Code (C): MEICC           1 (C)    18.00%  R1 180  R1 052  20.12%  R1 339  R1 229  12.64
         Code (D): MEICD           2 (C)    11.40%  R1 241  R1 109  13.19%  R2 759  R2 523  12.75
                                   3 (C)     7.48%  R1 242  R1 191  9.47%  R4 177  R3 911  12.55
          MANAGEMENT               4 (C)     9.81%  R1 454  R1 249  9.40%  R5 846  R5 374  11.49
                                   5 (C)     2.78%  R1 147  R1 276  7.81%  R7 360  R6 886  13.74
         Marriott Asset Management
         All asset management decisions are made  HISTORICAL DISTRIBUTIONS Actual payout (cents/unit) & 12-mnth historic yields
         together with the Marriott Investment  Period Ending End Price  Jan  Feb  Mar  Apr  May  Jun  Jul  Aug  Sep  Oct  Nov  Dec 12-mn
         Committee using an income-focused ap-                                        th
         proach to investing.      30 Jun 24 (C)  81.99  0.54  0.15  0.53  1.53  0.16  0.43  -  -  -  -  -  -  DY%
                                                                                     7.25
          FUND FOCUS               30 Jun 24 (D)  82.01  0.56  0.17  0.55  1.55  0.18  0.45  -  -  -  -  -  -  7.51
                                   31 Dec 23 (C)  80.41  0.27  0.15  0.73  0.75  0.44  0.41  0.39  0.19  0.57  0.65  0.37  0.41  6.63
         The Marriott Essential Income Fund has  31 Dec 23 (D)  80.43  0.29  0.17  0.75  0.77  0.46  0.43  0.41  0.21  0.59  0.66  0.39  0.43  6.90
         as its primary objective to provide a high  31 Dec 22 (C)  78.07  0.35  0.21  0.46  0.86  0.41  0.38  0.39  0.25  0.54  0.84  0.32  0.36  6.90
         level of reliable income for investors and  31 Dec 22 (D)  78.09  0.37  0.23  0.48  0.88  0.43  0.40  0.41  0.27  0.56  0.86  0.34  0.38  7.19
         to grow this income in line with inflation
         over time. The secondary consideration                  20   Risk / Return Profile
         is growth in capital in line with inflation
         over time. To achieve this objective the
         fund will invest, apart from liquid assets,
         in a blend of equities, REITS, collective             3yr Compound return(%)  10
         investment schemes in property, bonds
         and money market instruments. The
         portfolio will maintain a minimum equity
         exposure of 25% and a combined mini-                    0
                                                                           11
         mum exposure to REITS and collective                     0     Volatility p.a.  22
         investment schemes in property of 15%.
                                    PORTFOLIO ALLOCATION
          DETAILS as at 30 June 2024
          All fees and charges include Vat           June 2024      December 2023
                                   Sector        Value (R000)  % of Fund  Value (R000)  % of Fund  Difference
         Formation date:  11 Mar 2019  Real Estate Inv Trusts  171  30.30%  175  30.60%  -0.30%
         Min lump sum:        R500  RSA Equity        224    39.50%   223   39.00%  0.50%
         Minimum monthly:     R300  RSA Money Market   8     1.40%     14   2.50%   -1.10%
                                   RSA Govenment Bond
                                                             28.80%
                                                      163
                                                                                    0.90%
                                                                            27.90%
         Top-up investment:   R300  Total            566    100.00%   160  100.00%  -1.05%
                                                                      572
         No of holdings:        19
                                    TOP HOLDINGS BY VALUE
         No of unitholders:    449
         Original price:       100                       June 2024    December 2023
         Broker p.a. com (C):  0.58%  Short Name/       Units  Value  %of  Units  Value  %of Difference
                                   JSE Code  Sector Name  (000’s) (R ‘000)  Fund  (000’s) (R ‘000)  Fund  (000’s)
         Annual fee (C):      0.86%  R2035   SA Bnds   184 385 157 985 27.89%  182 289 159 391 27.88%  2 096
         TER (C) 06/24:       0.89%  RESILIENT  Real Est  755  35 755  6.31%  615  27 251  4.77%  140
         TER Perf% (C):       0.00%  STANBANK  Financials  172  35 697  6.30%  124  25 762  4.51%  48
                                                         474
                                                                       365
         Fund value:       R566.50m  FIRSTRAND  Financials  2 448  35 480  6.26%  2 134  26 796  4.69%  109
                                             Real Est
                                                            34 609
                                                                6.11%
                                                                                     314
                                   STOR-AGE
                                                                              4.87%
                                                                          27 866
         Risk rating:   Medium - High  NEPIROCK  Real Est  257  33 573  5.93%  287  36 246  6.34%  (30)
         PlexCrowns:               GROWPNT   Real Est   2 497  30 389  5.37%  2 545  29 721  5.20%  (48)
                                   SHOPRIT   Cons        96  27 032  4.77%  97  26 542  4.64%  (1)
                                   VUKILE    Real Est   1 766  26 452  4.67%  2 122  29 970  5.24%  (356)
                                   RICHEMONT  Cons        7  20 374  3.60%  7  17 321  3.03%  0
                                   TOTAL                   437 346 77.21%
                                            Price History       Relative Strength to Consumer Price Index
                                      100                       1.0
                                      94                        0.9
                                      88                        0.8
                                      82                        0.7
                                      76                        0.6
                                      70                        0.5
                                         |  20  |  21  |  22  |  23  |  |  20  |  21  |  22  |  23  |
         270                                Profile’s Unit Trusts & Collective Investments — DOMESTIC