
Page 276 - Profiles's Unit Trusts & Collective Investments - September 2024
P. 276
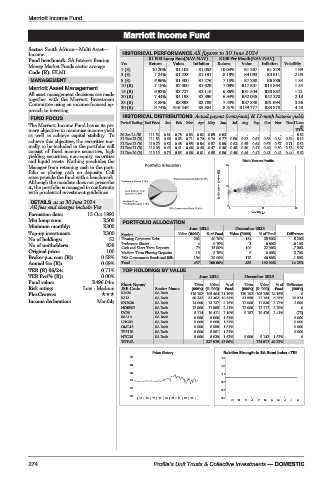
Marriott Income Fund

                                    Marriott Income Fund
         Marriott Income Fund
         Sector: South African—Multi Asset—
         Income                     HISTORICAL PERFORMANCE All figures to 30 June 2024
         Fund benchmark: SA Interest Bearing  R1 000 Lump Sum(NAV-NAV)  R100 Per Month(NAV-NAV)
         Money Market Funds sector average  Yrs  Return  Value  Inflation  Return  Value  Inflation  Volatility
         Code (R): HLMI            1 (R)    10.20%  R1 102  R1 052  10.04%  R1 267  R1 229  1.99
                                   3 (R)     7.24%  R1 233  R1 191  8.19%  R4 093  R3 911  2.03
          MANAGEMENT               5 (R)     6.96%  R1 400  R1 276  7.15%  R7 230  R6 886  1.84
         Marriott Asset Management  10 (R)   7.18%  R2 000  R1 629  7.09%  R17 501  R15 564  1.34
         All asset management decisions are made  15 (R)  6.92%  R2 727  R2 116  6.86%  R31 504  R26 882  1.21
         together with the Marriott Investment  20 (R)  7.44%  R4 198  R2 896  6.94%  R52 045  R42 270  2.18
         Committee using an income-focused ap-  25 (R)  8.88%  R8 393  R3 789  7.43%  R87 340  R61 994  3.36
         proach to investing.      30 (R)    9.74%  R16 246  R5 384  8.31%  R159 777  R88 878  4.48
          FUND FOCUS                HISTORICAL DISTRIBUTIONS Actual payout (cents/unit) & 12-mnth historic yields
         The Marriott Income Fund has as its pri-  Period Ending End Price  Jan  Feb  Mar  Apr  May  Jun  Jul  Aug  Sep  Oct  Nov  Dec 12-mn
                                                                                      th
         mary objective to maximise income yield                                     DY%
         as well as achieve capital stability. To  30 Jun 24 (R)  111.54  0.81  0.78  0.83  0.82  0.85  0.83  -  -  -  -  -  -  8.82
         achieve this objective, the securities nor-  31 Dec 23 (R)  111.83  0.68  0.63  0.71  0.70  0.74  0.77  0.80  0.82  0.82  0.83  0.84  0.82  8.19
         mally to be included in the portfolio will  31 Dec 22 (R)  110.79  0.52  0.48  0.55  0.54  0.57  0.59  0.63  0.65  0.64  0.67  0.67  0.71  6.52
                                                                  0.48
                                                         0.46
                                                                         0.47
                                                                     0.50
                                                               0.46
                                                   0.41
                                                      0.48
                                                            0.47
                                                                            0.49
                                   31 Dec 21 (R)
                                           112.08
                                               0.45
                                                                               0.50
                                                                                  0.53
                                                                                     5.07
         consist of fixed income securities, high  31 Dec 20 (R)  113.19  0.70  0.65  0.68  0.61  0.55  0.50  0.49  0.46  0.42  0.43  0.42  0.44  5.62
         yielding securities, non-equity securities
         and liquid assets. Nothing precludes the                     Risk / Return Profile
         Manager from retaining cash in the port-                20
         folio or placing cash on deposits. Call
         rates provide the fund with a benchmark.
         Although the mandate does not prescribe               3yr Compound return(%)
         it, the portfolio is managed in conformity              10
         with prudential investment guidelines.
          DETAILS as at 30 June 2024
          All fees and charges include Vat                       0 0       11       22
                                                                        Volatility p.a.
         Formation date:  15 Oct 1993
         Min lump sum:        R500  PORTFOLIO ALLOCATION
         Minimum monthly:     R300                     June 2024    December 2023
         Top-up investment:   R300  Sector         Value (R000)  % of Fund  Value (R000)  % of Fund  Difference
         No of holdings:        52  Floating Corporate Debt  202  40.70%  154  35.50%  5.20%
         No of unitholders:    838  Preference Shares    4   0.70%      3   0.80%   -0.10%
                                   Cash and Short Term Deposits  79  15.90%  100  22.90%  -7.00%
         Original price:       100  Medium Term Floating Deposits  18  3.70%  0  0.00%  3.70%
         Broker p.a. com (R):  0.58%  RSA Government Bonds and Bills  194  39.00%  178  40.80%  -1.80%
         Annual fee (R):      0.69%  Total              497  100.00%  435  100.00%  14.25%
         TER (R) 06/24:       0.71%  TOP HOLDINGS BY VALUE
         TER Perf% (R):       0.00%                      June 2024    December 2023
         Fund value:       R496.04m
                                   Short Name/          Units  Value  %of  Units  Value  %of Difference
         Risk rating:   Low - Medium  JSE Code  Sector Name  (000’s) (R ‘000)  Fund  (000’s) (R ‘000)  Fund  (000’s)
         PlexCrowns:               R2030     SA Bnds   110 192 105 404 21.19%  110 192 105 168 24.18%  0
         Income declaration:  Monthly  R213  SA Bnds   60 232  52 402 10.54%  31 558  27 184  6.25%  28 674
                                   RN2030    SA Bnds   14 000  13 737  2.76%  12 000  11 830  2.72%  2 000
                                   NDBB02    SA Bnds   12 000  11 995  2.41%  12 000  12 117  2.79%  0
                                   I2029     SA Bnds    8 114  10 411  2.10%  8 187  10 476  2.41%  (73)
                                   SSA10     SA Bnds    9 000  9 000  1.81%         9 000
                                   LHC03     SA Bnds    9 000  9 000  1.81%         9 000
                                   OML18     SA Bnds    9 000  8 999  1.81%         9 000
                                   TFS179    SA Bnds    9 000  8 991  1.81%         9 000
                                   NTC36     SA Bnds    8 000  8 039  1.62%  8 000  8 142  1.87%  0
                                   TOTAL                   237 978 47.86%  174 917 40.22%
                                            Price History       Relative Strength to SA Bond Index - TRI
                                      120                       1.5
                                      117
                                                                1.3
                                      114
                                                                1.1
                                      111
                                                                0.9
                                      108
                                                                0.7
                                      105
                                        | 15 | 16 | 17 | 18 | 19 | 20 | 21 | 22 | 23 |  0.5
                                                                  O  N  D  J  F  M  A  M  J  J  A
         274                                Profile’s Unit Trusts & Collective Investments — DOMESTIC