
Page 271 - Profiles's Unit Trusts & Collective Investments - September 2024
P. 271
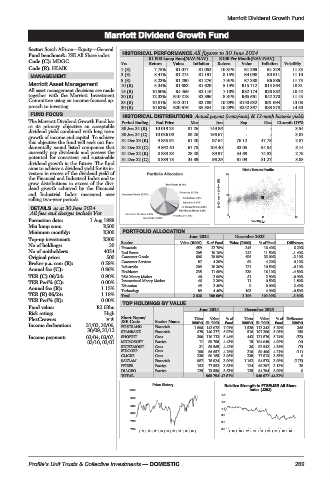
Marriott Dividend Growth Fund

                              Marriott Dividend Growth Fund
         Marriott Dividend Growth Fund
         Sector: South African—Equity—General
         Fund benchmark: JSE All Share index  HISTORICAL PERFORMANCE All figures to 30 June 2024
         Code (C): MDGC                    R1 000 Lump Sum(NAV-NAV)  R100 Per Month(NAV-NAV)
                                   Yrs     Return  Value  Inflation  Return  Value  Inflation  Volatility
         Code (R): HLMK
                                   1 (R)     7.75%  R1 077  R1 052  10.31%  R1 269  R1 229  11.25
          MANAGEMENT               3 (R)     8.41%  R1 274  R1 191  8.15%  R4 090  R3 911  11.10
                                   5 (R)     5.23%  R1 290  R1 276  7.91%  R7 380  R6 886  11.75
         Marriott Asset Management
                                   10 (R)    5.34%  R1 683  R1 629  5.14%  R15 712  R15 564  10.31
         All asset management decisions are made  15 (R)  10.50%  R4 469  R2 116  7.10%  R32 174  R26 882  10.42
         together with the Marriott Investment  20 (R)  12.32%  R10 218  R2 896  8.81%  R65 661  R42 270  11.45
         Committee using an income-focused ap-  25 (R)  10.81%  R13 011  R3 789  10.29%  R140 632  R61 994  13.08
         proach to investing.
                                   30 (R)   10.62%  R20 676  R5 384  10.29%  R242 367  R88 878  14.50
          FUND FOCUS
                                    HISTORICAL DISTRIBUTIONS Actual payout (cents/unit) & 12-mnth historic yields
         The Marriott Dividend Growth Fund has  Period Ending  End Price  Mar  Jun  Sep  Dec  12-mnth DY%
         as its primary objective an acceptable
         dividend yield combined with long term  30 Jun 24 (R)  10 019.25  81.26  149.86  -  -  3.54
         growth of income and capital. To achieve  30 Jun 24 (C)  10 026.06  88.26  156.67  -  -  3.82
         this objective the fund will seek out fun-  31 Dec 23 (R)  9 855.64  61.20  97.64  76.12  47.78  2.87
         damentally sound listed companies that  31 Dec 23 (C)  9 862.40  67.75  104.40  83.05  54.54  3.14
         currently pay dividends and possess the  31 Dec 22 (R)  8 883.33  28.48  89.97  54.69  74.82  2.79
         potential for consistent and sustainable  31 Dec 22 (C)  8 889.78  34.89  96.29  61.09  81.27  3.08
         dividend growth in the future. The fund
         aims to achieve a dividend yield for its in-
         vestors in excess of the dividend yield of              20   Risk / Return Profile
         the Financial and Industrial Index and to
         grow distributions in excess of the divi-
         dend growth achieved by the Financial
         and Industrial Index measured over                    3yr Compound return(%)  10
         rolling two-year periods.
          DETAILS as at 30 June 2024
          All fees and charges include Vat                       0
                                                                  0        11       22
         Formation date:  1 Aug 1988                                    Volatility p.a.
         Min lump sum:        R500
         Minimum monthly:     R300  PORTFOLIO ALLOCATION
                                                       June 2024    December 2023
         Top-up investment:   R300
         No of holdings:        30  Sector          Value (R000)  % of Fund  Value (R000)  % of Fund  Difference
                                                                      345
                                                             22.70%
                                   Financials
                                                        459
                                                                            16.40%
                                                                                    6.20%
         No of unitholders:   4054  Real Estate         205  10.10%   242   11.50%  -1.40%
         Original price:       500  Consumer Goods      606  29.90%   695   33.00%  -3.10%
         Broker p.a. com (R):  0.58%  Consumer Services  87  4.30%     89   4.20%   0.10%
         Annual fee (C):      0.86%  Industrials        209  10.30%   221   10.50%  -0.10%
                                   Healthcare
                                                             11.60%
                                                                      339
                                                                                    -4.50%
                                                        235
                                                                            16.10%
         TER (C) 06/24:       0.90%  RSA Money Market    40  2.00%     61   2.90%   -0.90%
         TER Perf% (C):       0.00%  International Money Market  46  2.30%  11  0.50%  1.80%
                                   Education             49  2.40%      0   0.00%   2.40%
         Annual fee (R):      1.15%
                                   Technology            89  4.40%    103   4.90%   -0.50%
         TER (R) 06/24:       1.18%  Total             2 026  100.00%  2 106  100.00%  -3.80%
         TER Perf% (R):       0.00%  TOP HOLDINGS BY VALUE
         Fund value:        R2.03bn                      June 2024    December 2023
         Risk rating:         High
                                   Short Name/
                                                            Value
                                                        Units
                                                                               %of Difference
                                                                           Value
                                                                 %of
                                                                      Units
         PlexCrowns:               JSE Code  Sector Name  (000’s) (R ‘000)  Fund  (000’s) (R ‘000)  Fund  (000’s)
         Income declaration:  31/03, 30/06,  FIRSTRAND  Financials  1 896 142 072  7.01%  1 528 112 342  5.29%  368
                          30/09, 31/12  STANBANK  Financials  675 140 277  6.92%  516 107 286  5.05%  159
         Income payment:  03/04, 03/07,  SHOPRIT  Cons   390 110 173  5.44%  443 121 876  5.74%  (53)
                          03/10, 03/01  MICROSOFT  Foreign  11  89 798  4.43%  15 104 049  4.90%  (4)
                                   RICHEMONT  Cons       31  89 565  4.42%  36  92 542  4.36%  (5)
                                   BIDCORP   Cons        199  86 657  4.28%  210  89 406  4.21%  (11)
                                   CLICKS    Cons        238  80 185  3.96%  238  77 513  3.65%  0
                                   SANLAM    Financials  987  78 924  3.90%  1 162  84 573  3.98%  (175)
                                   PFIZER    Foreign     152  77 552  3.83%  124  66 297  3.12%  28
                                   DIAGEO    Foreign     125  73 550  3.63%  125  84 794  3.99%  0
                                   TOTAL                   968 754 47.81%  940 677 44.31%
                                            Price History       Relative Strength to FTSE/JSE All Share
                                     10500                              index (J203)
                                                                1.5
                                      9800
                                                                1.3
                                      9100
                                                                1.1
                                      8400
                                                                0.9
                                      7700                      0.7
                                      7000                      0.5
                                        | 15 | 16 | 17 | 18 | 19 | 20 | 21 | 22 | 23 |  |15| 16 |17| 18 |19 | 20 |21 | 22 | 23|
         Profile’s Unit Trusts & Collective Investments — DOMESTIC                   269