
Page 284 - Profiles's Unit Trusts & Collective Investments - September 2024
P. 284
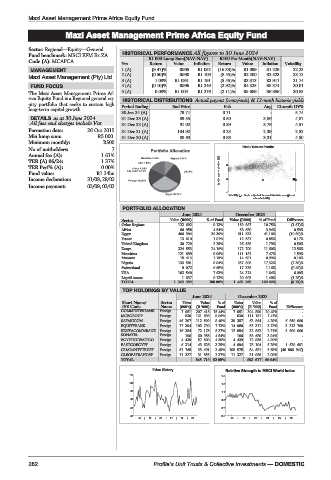
Mazi Asset Management Prime Africa Equity Fund

                    Mazi Asset Management Prime Africa Equity Fund
         Mazi Asset Management Prime Africa Equity Fund
         Sector: Regional—Equity—General
         Fund benchmark: MSCI EFM Ex ZA  HISTORICAL PERFORMANCE All figures to 30 June 2024
         Code (A): MCAFCA                  R1 000 Lump Sum(NAV-NAV)  R100 Per Month(NAV-NAV)
                                   Yrs     Return  Value  Inflation  Return  Value  Inflation  Volatility
          MANAGEMENT               1 (A)    (9.47)%  R905  R1 052  (16.33)%  R1 099  R1 229  22.23
                                   2 (A)    (0.50)%  R990  R1 109  (8.45)%  R2 200  R2 523  23.12
         Mazi Asset Management (Pty) Ltd.
                                   3 (A)     1.08%  R1 033  R1 191  (5.45)%  R3 313  R3 911  21.74
          FUND FOCUS               4 (A)    (0.10)%  R996  R1 249  (2.92)%  R4 525  R5 374  20.01
         The Mazi Asset Management Prime Af-  5 (A)  0.08%  R1 004  R1 276  (2.11)%  R5 689  R6 886  20.85
         rica Equity Fund is a Regional general eq-  HISTORICAL DISTRIBUTIONS Actual payout (cents/unit) & 12-mnth historic yields
         uity portfolio that seeks to sustain high
         long-term capital growth.  Period Ending  End Price    Feb         Aug  12-mnth DY%
                                   30 Jun 24 (A)    79.71       0.71         -       5.74
          DETAILS as at 30 June 2024  31 Dec 23 (A)  89.55      0.50       3.86      4.87
          All fees and charges include Vat
                                   31 Dec 22 (A)    91.02       0.39       3.76      4.57
         Formation date:  26 Oct 2015  31 Dec 21 (A)  104.92    0.25       2.39      2.52
         Min lump sum:       R5 000  31 Dec 20 (A)  88.63       0.68       3.31      4.50
         Minimum monthly:     R500
         No of unitholders:      7                                    Risk / Return Profile
         Annual fee (A):      1.61%
         TER (A) 06/24:       1.37%
         TER Perf% (A):       0.00%                              20
         Fund value:        R1.34bn                            3yr Compound return(%)
         Income declaration:  31/08, 28/02                       10        11       22
         Income payment:  03/09, 03/03
                                                                 -1
                                                                  Volatility p.a. Scale adjusted to accommodate exceptional
                                                                         return/volatility.
                                    PORTFOLIO ALLOCATION
                                                     June 2024      December 2023
                                   Sector        Value (R000)  % of Fund  Value (R000)  % of Fund  Difference
                                   Other Regions   122 692   9.13%  159 887  10.75%  (1.61)%
                                   Africa           60 958   4.54%   58 680  3.94%  0.59%
                                   Egypt           406 994   30.30%  611 633  41.10%  (10.80)%
                                   France           13 610   1.01%   12 587  0.85%  0.17%
                                   United Kingdom   30 729   2.29%   26 589  1.79%  0.50%
                                   Kenya           324 553   24.16%  172 700  11.60%  12.56%
                                   Mauritius       121 699   9.06%  111 181  7.47%  1.59%
                                   Morocco          15 413   1.15%   14 691  0.99%  0.16%
                                   Nigeria         133 501   9.94%  257 808  17.32%  (7.39)%
                                   Switzerland      9 072    0.68%   17 335  1.16%  (0.49)%
                                   USA             102 540   7.63%   24 374  1.64%  6.00%
                                   Liquid Assets    1 637    0.12%   20 802  1.40%  (1.28)%
                                   TOTAL          1 343 399  100.00%  1 488 268  100.00%  (9.73)%
                                    TOP HOLDINGS BY VALUE
                                                       June 2024    December 2023
                                   Short Name/  Sector  Units  Value  %of  Units  Value  %of
                                   JSE Code   Name  (000’s)  (R ‘000)  Fund  (000’s)  (R ‘000)  Fund  Difference
                                   COMMINTERBANK  Foreign  7 051  207 418  15.44%  7 051  304 890  20.49%  -
                                   MCBGROUP   Foreign  830  121 699  9.06%  830  111 181  7.47%  -
                                   SAFARICOM  Foreign  46 207  112 899  8.40%  39 357  63 864  4.29%  6 850 000
                                   EQUITYBANK  Foreign  17 394  103 790  7.73%  14 080  55 311  3.72%  3 313 700
                                   KENYACOMMBANK  Foreign  16 354  72 178  5.37%  12 854  32 862  2.21%  3 500 000
                                   SONATEL    Foreign  106  60 958  4.54%  106  58 680  3.94%  -
                                   EGYPTKUWAITCO  Foreign  4 439  57 800  4.30%  4 439  72 955  4.90%  -
                                   EASTCOEGYPT  Foreign  6 314  43 628  3.25%  4 694  78 104  5.25%  1 620 691
                                   GUARANTYTRUST  Foreign  61 768  33 491  2.49%  108 575  84 681  5.69%  (46 806 947)
                                   CLEOPATRAHOSP  Foreign  11 327  31 855  2.37%  11 327  31 088  2.09%  -
                                   TOTAL                845 719  62.95%  893 617  60.04%
                                            Price History        Relative Strength to MSCI World index
                                      110
                                                                1.5
                                      104                       1.3
                                      98                        1.1
                                      92                        0.9
                                      86                        0.7
                                      80                        0.5
                                        18  |  19  |  20  |  21  |  22  |  23  18  |  19  |  20  |  21  |  22  |  23


         282                                Profile’s Unit Trusts & Collective Investments — DOMESTIC