
Page 298 - Profiles's Unit Trusts & Collective Investments - September 2024
P. 298
PSG Diversified Income Fund
PSG Diversified Income Fund
PSG Diversified Income Fund
Sector: South African—Multi Asset—
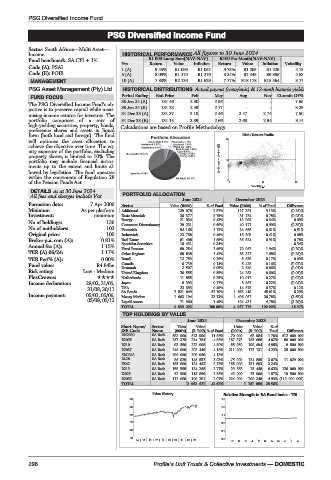
Income HISTORICAL PERFORMANCE All figures to 30 June 2024
Fund benchmark:SACPI+1% R1 000 Lump Sum(NAV-NAV) R100 Per Month(NAV-NAV)
Code (A): PSAI Yrs Return Value Inflation Return Value Inflation Volatility
Code (E): POIE 1 (A) 9.45% R1 095 R1 052 9.73% R1 265 R1 229 4.18
5 (A) 8.08% R1 474 R1 276 8.24% R7 445 R6 886 4.53
MANAGEMENT 10 (A) 7.88% R2 134 R1 629 7.77% R18 178 R15 564 3.77
PSG Asset Management (Pty) Ltd. HISTORICAL DISTRIBUTIONS Actual payout (cents/unit) & 12-mnth historic yields
FUND FOCUS Period Ending End Price Feb May Aug Nov 12-mnth DY%
30 Jun 24 (A) 131.46 2.30 2.56 - - 7.66
The PSG Diversified Income Fund’s ob-
jective is to preserve capital while maxi- 30 Jun 24 (E) 131.25 2.49 2.77 - - 8.29
mising income returns for investors. The 31 Dec 23 (A) 131.37 2.18 2.46 2.47 2.74 7.50
portfolio comprises of a mix of 31 Dec 23 (E) 131.15 2.39 2.66 2.68 2.94 8.14
high-yielding securities, property, bonds, Calculations are based on Profile Methodology
preference shares and assets in liquid
form (both local and foreign). The fund Risk / Return Profile
will optimise the asset allocation to 20
achieve the objective over time. The eq-
uity exposure of the portfolio, excluding
property shares, is limited to 10%. The 3yr Compound return(%)
portfolio may include financial instru- 10
ments up to the extent and limits al-
lowed by legislation. The fund operates
within the constraints of Regulation 28
of the Pension Funds Act. 0 0 11 22
Volatility p.a.
DETAILS as at 30 June 2024 PORTFOLIO ALLOCATION
All fees and charges include Vat
June 2024 December 2023
Formation date: 7 Apr 2006 Sector Value (R000) % of Fund Value (R000) % of Fund Difference
Minimum As per platform Additional 139 078 2.87% 127 381 3.13% (0.26)%
Investment: minimum Basic Materials 36 377 0.75% 31 754 0.78% (0.03)%
No of holdings: 136 Energy 21 034 0.43% 13 993 0.34% 0.09%
Consumer Discretionary 29 231 0.60% 40 177 0.99% (0.38)%
No of unitholders: 103 Financials 54 166 1.12% 24 668 0.61% 0.51%
Original price: 100 Industrials 23 768 0.49% 16 803 0.41% 0.08%
Broker p.a. com (A): 0.81% Real Estate 81 408 1.68% 36 824 0.91% 0.78%
Annual fee (A): 1.15% Specialist Securities 16 431 0.34% 0.34%
Fixed Interest 80 254 1.66% 79 062 1.94% (0.29)%
TER (A) 06/24: 1.17% Other Regions 68 838 1.42% 68 327 1.68% (0.26)%
TER Perf% (A): 0.00% Brazil 12 753 0.26% 6 839 0.17% 0.09%
Fund value: R4.84bn Canada 6 739 0.14% 6 428 0.16% (0.02)%
Risk rating: Low - Medium Denmark 2 507 0.05% 2 640 0.06% (0.01)%
United Kingdom 26 555 0.55% 24 283 0.60% (0.05)%
PlexCrowns: Netherlands 11 855 0.25% 10 917 0.27% (0.02)%
Income declaration: 28/02, 31/05, Japan 8 393 0.17% 8 887 0.22% (0.04)%
31/08, 30/11 USA 23 693 0.49% 14 878 0.37% 0.12%
SA Bonds 2 521 049 52.10% 1 863 419 45.81% 6.29%
Income payment: 05/03, 05/06,
05/09, 05/12 Money Market 1 603 194 33.13% 1 496 057 36.78% (3.65)%
4.78%
194 431
71 960
Liquid Assets
1.49%
(3.29)%
TOTAL 4 839 292 100.00% 4 067 776 100.00% 18.97%
TOP HOLDINGS BY VALUE
June 2024 December 2023
Short Name/ Sector Units Value Units Value %of
JSE Code Name (000’s) (R ‘000) % of Fund (000’s) (R ‘000) Fund Difference
RN2030 SA Bnds 582 000 573 990 11.86% 70 000 68 984 1.70% 512 000 000
R2035 SA Bnds 267 375 234 784 4.85% 187 375 163 688 4.02% 80 000 000
R210 SA Bnds 93 550 222 008 4.59% 85 050 198 694 4.88% 8 500 000
R2037 SA Bnds 246 000 202 440 4.18% 211 000 172 131 4.23% 35 000 000
SBC048 SA Bnds 200 000 200 060 4.13%
EL28 SA Bnds 86 029 146 557 3.03% 75 000 124 865 3.07% 11 029 000
ES42 SA Bnds 185 000 134 463 2.78% 185 000 131 893 3.24% -
R213 SA Bnds 155 558 134 268 2.77% 29 558 25 448 0.63% 126 000 000
I2025 SA Bnds 62 500 113 850 2.35% 43 000 75 906 1.87% 19 500 000
R2032 SA Bnds 112 000 100 201 2.07% 224 000 200 348 4.93% (112 000 000)
TOTAL 2 062 621 42.62% 1 161 956 28.56%
Price History Relative Strength to SA Bond Index - TRI
140
1.5
130
1.3
120
1.1
110
0.9
100
0.7
90
14 | 15 | 16 | 17 | 18 | 19 | 20 | 21 | 22 | 23 0.5
O N D J F M A M J J A
296 Profile’s Unit Trusts & Collective Investments — DOMESTIC