
Page 301 - Profiles's Unit Trusts & Collective Investments - September 2024
P. 301
PSG Global Equity Feeder Fund
PSG Global Equity Feeder Fund
PSG Global Equity Feeder Fund
Sector: Global—Equity—General
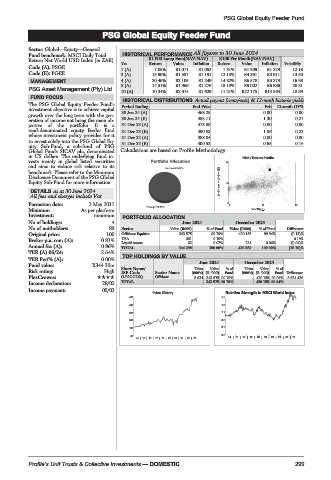
Fund benchmark: MSCI Daily Total HISTORICAL PERFORMANCE All figures to 30 June 2024
Return Net World USD Index (in ZAR) R1 000 Lump Sum(NAV-NAV) R100 Per Month(NAV-NAV)
Code (A): PSGE Yrs Return Value Inflation Return Value Inflation Volatility
Code (E): PGEE 1 (A) 7.05% R1 071 R1 052 1.31% R1 209 R1 229 12.16
3 (A) 15.90% R1 557 R1 191 12.15% R4 361 R3 911 13.50
MANAGEMENT 4 (A) 20.46% R2 105 R1 249 14.82% R6 578 R5 374 16.98
5 (A) 14.51% R1 969 R1 276 15.13% R9 002 R6 886 20.81
PSG Asset Management (Pty) Ltd.
10 (A) 10.34% R2 674 R1 629 11.21% R22 175 R15 564 18.99
FUND FOCUS
HISTORICAL DISTRIBUTIONS Actual payout (cents/unit) & 12-mnth historic yields
The PSG Global Equity Feeder Fund’s Period Ending End Price Feb 12-mnth DY%
investment objective is to achieve capital
growth over the long term with the gen- 30 Jun 24 (A) 468.25 0.00 0.00
eration of income not being the main ob- 30 Jun 24 (E) 485.11 1.30 0.27
jective of the portfolio. It is a 31 Dec 23 (A) 473.88 0.00 0.00
rand-denominated equity feeder fund 31 Dec 23 (E) 490.83 1.06 0.22
whose investment policy provides for it 31 Dec 22 (A) 388.04 0.00 0.00
to invest solely into the PSG Global Eq-
uity Sub-Fund, a sub-fund of PSG 31 Dec 22 (E) 400.52 0.65 0.16
Global Funds SICAV plc, denominated Calculations are based on Profile Methodology
in US dollars. The underlying fund in- Risk / Return Profile
vests mainly in global listed securities 20
and aims to reduce risk relative to its
benchmark. Please refer to the Minimum
Disclosure Document of the PSG Global
Equity Sub-Fund for more information. 3yr Compound return(%) 10
DETAILS as at 30 June 2024
All fees and charges include Vat
Formation date: 3 May 2011 0 0 11 22
Minimum As per platform Volatility p.a.
Investment: minimum
PORTFOLIO ALLOCATION
No of holdings: 4 June 2024 December 2023
No of unitholders: 89 Sector Value (R000) % of Fund Value (R000) % of Fund Difference
Original price: 100 Offshore Equities 343 575 99.79% 420 155 99.94% (0.15)%
Broker p.a. com (A): 0.81% USA 661 0.19% 0.19%
Liquid Assets 62 0.02% 234 0.06% (0.04)%
Annual fee (A): 0.86% TOTAL 344 298 100.00% 420 389 100.00% (18.10)%
TER (A) 06/24: 2.64%
TER Perf% (A): 0.00% TOP HOLDINGS BY VALUE
Fund value: R344.30m Short Name/ June 2024 December 2023
%of
Units
Value
Units
Value
%of
Risk rating: High JSE Code Sector Name (000’s) (R ‘000) Fund (000’s) (R ‘000) Fund Difference
PlexCrowns: O-PSGGLEQ Offshore 8 624 343 575 99.79% - 420 155 99.94% 8 624 426
Income declaration: 28/02 TOTAL 343 575 99.79% 420 155 99.94%
Income payment: 05/03
Price History Relative Strength to MSCI World index
480 1.5
400 1.3
320 1.1
240 0.9
160 0.7
80 0.5
14 | 15 | 16 | 17 | 18 | 19 | 20 | 21 | 22 | 23 14 | 15 | 16 | 17 | 18 | 19 | 20 | 21 | 22 | 23
Profile’s Unit Trusts & Collective Investments — DOMESTIC 299