
Page 299 - Profiles's Unit Trusts & Collective Investments - September 2024
P. 299
PSG Income Fund
PSG Income Fund
PSG Income Fund
Sector: South African—Interest Bearing—
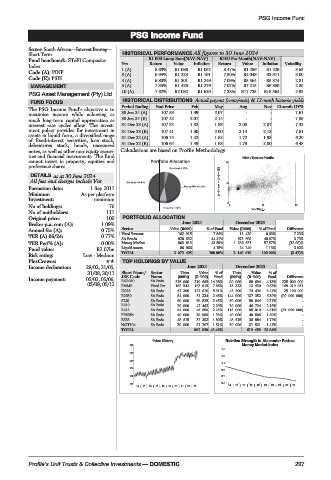
Short Term HISTORICAL PERFORMANCE All figures to 30 June 2024
Fund benchmark: STeFI Composite R1 000 Lump Sum(NAV-NAV) R100 Per Month(NAV-NAV)
Index Yrs Return Value Inflation Return Value Inflation Volatility
Code (A): PINF 1 (A) 8.63% R1 086 R1 052 8.47% R1 256 R1 229 3.65
Code (E): PSIE 3 (A) 6.94% R1 223 R1 191 7.50% R4 049 R3 911 3.00
4 (A) 6.80% R1 301 R1 249 7.09% R5 564 R5 374 2.81
MANAGEMENT 5 (A) 7.35% R1 426 R1 276 7.07% R7 215 R6 886 2.86
10 (A) 7.62% R2 082 R1 629 7.33% R17 735 R15 564 2.92
PSG Asset Management (Pty) Ltd.
HISTORICAL DISTRIBUTIONS Actual payout (cents/unit) & 12-mnth historic yields
FUND FOCUS
Period Ending End Price Feb May Aug Nov 12-mnth DY%
The PSG Income Fund’s objective is to
maximise income while achieving as 30 Jun 24 (A) 107.53 1.99 2.07 - - 7.61
much long-term capital appreciation as 30 Jun 24 (E) 107.42 2.07 2.14 - - 7.89
interest rate cycles allow. The invest- 31 Dec 23 (A) 107.52 1.82 1.93 2.05 2.07 7.32
ment policy provides for investment in 31 Dec 23 (E) 107.41 1.90 2.00 2.14 2.13 7.61
assets in liquid form, a diversified range 31 Dec 22 (A) 106.74 1.42 1.55 1.72 1.93 6.20
of fixed-interest securities, loan stock,
debentures stock, bonds, unsecured 31 Dec 22 (E) 106.64 1.49 1.63 1.79 2.00 6.48
notes, as well as other non-equity securi- Calculations are based on Profile Methodology
ties and financial instruments. The fund Risk / Return Profile
cannot invest in property, equities and 20
preference shares.
DETAILS as at 30 June 2024
All fees and charges include Vat 3yr Compound return(%) 10
Formation date: 1 Sep 2011
Minimum As per platform
Investment: minimum
0
No of holdings: 76 0 11 22
Volatility p.a.
No of unitholders: 111
Original price: 100 PORTFOLIO ALLOCATION
Broker p.a. com (A): 1.09% June 2024 December 2023
Sector Value (R000) % of Fund Value (R000) % of Fund Difference
Annual fee (A): 0.75%
Fixed Interest 162 915 7.86% 13 430 0.63% 7.23%
TER (A) 06/24: 0.77% SA Bonds 920 632 44.41% 873 699 40.67% 3.73%
TER Perf% (A): 0.00% Money Market 903 813 43.59% 1 236 651 57.57% (13.98)%
Fund value: R2.07bn Liquid Assets 86 066 4.15% 24 240 1.13% 3.02%
Risk rating: Low - Medium TOTAL 2 073 425 100.00% 2 148 019 100.00% (3.47)%
PlexCrowns: TOP HOLDINGS BY VALUE
Income declaration: 28/02, 31/05, June 2024 December 2023
31/08, 30/11 Short Name/ Sector Units Value %of Units Value %of
JSE Code Name (000’s) (R ‘000) Fund (000’s) (R ‘000) Fund Difference
Income payment: 05/03, 05/06,
05/09, 05/12 RN2030 SA Bnds 315 000 310 665 14.98% 90 000 88 694 4.13% 225 000 000
PMMB Fixed Int 162 542 162 915 7.86% 13 323 13 430 0.63% 149 219 051
I2025 SA Bnds 67 300 122 610 5.91% 42 200 74 494 3.47% 25 100 000
R2030 SA Bnds 54 000 51 334 2.48% 144 000 137 352 6.39% (90 000 000)
SLI6 SA Bnds 50 000 50 825 2.45% 50 000 50 844 2.37% -
R210 SA Bnds 20 000 47 463 2.29% 20 000 46 724 2.18% -
R213 SA Bnds 54 000 46 609 2.25% 115 000 99 010 4.61% (61 000 000)
FRS354 SA Bnds 40 000 39 999 1.93% 40 000 40 506 1.89% -
ES33 SA Bnds 48 615 37 393 1.80% 48 615 36 884 1.72% -
NGT104 SA Bnds 30 000 31 207 1.51% 30 000 31 521 1.47% -
TOTAL 901 020 43.46% 619 459 28.84%
Price History Relative Strength to Alexander Forbes
110 Money Market Index
1.5
108
1.3
106
1.1
104
0.9
102 0.7
100 0.5
14 | 15 | 16 | 17 | 18 | 19 | 20 | 21 | 22 | 23 14 | 15 | 16 | 17 | 18 | 19 | 20 | 21 | 22 | 23
Profile’s Unit Trusts & Collective Investments — DOMESTIC 297