
Page 297 - Profiles's Unit Trusts & Collective Investments - September 2024
P. 297
PSG Stable Fund
PSG Stable Fund
PSG Stable Fund
Sector: South African—Multi Asset—
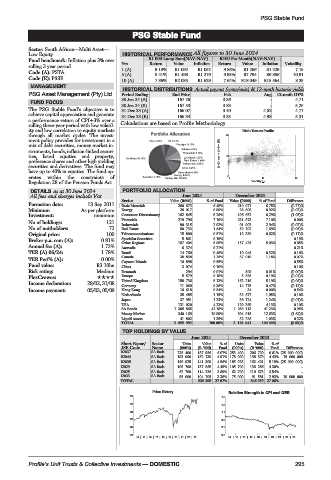
Low Equity HISTORICAL PERFORMANCE All figures to 30 June 2024
Fund benchmark: Inflation plus 3% over R1 000 Lump Sum(NAV-NAV) R100 Per Month(NAV-NAV)
rolling 3 year period Yrs Return Value Inflation Return Value Inflation Volatility
Code (A): PSTA 1 (A) 9.18% R1 092 R1 052 9.86% R1 266 R1 229 7.19
Code (E): PSSE 5 (A) 8.41% R1 498 R1 276 9.93% R7 794 R6 886 10.91
10 (A) 7.36% R2 035 R1 629 7.64% R18 049 R15 564 8.39
MANAGEMENT
HISTORICAL DISTRIBUTIONS Actual payout (cents/unit) & 12-mnth historic yields
PSG Asset Management (Pty) Ltd. Period Ending End Price Feb Aug 12-mnth DY%
30 Jun 24 (A) 167.26 3.36 - 4.71
FUND FOCUS
30 Jun 24 (E) 167.53 3.83 - 5.26
The PSG Stable Fund’s objective is to 31 Dec 23 (A) 166.07 3.40 4.52 4.77
achieve capital appreciation and generate 31 Dec 23 (E) 166.34 3.85 4.98 5.31
a performance return of CPI+3% over a
rolling three-year period with low volatil- Calculations are based on Profile Methodology
ity and low correlation to equity markets Risk / Return Profile
through all market cycles. The invest- 20
ment policy provides for investment in a
mix of debt securities, money market in-
struments, bonds, inflation-linked securi-
ties, listed equities and property, 3yr Compound return(%) 10
preference shares and other high yielding
securities and derivatives. The fund may
have up to 40% in equities. The fund op-
erates within the constraints of 0 0 11 22
Regulation 28 of the Pension Funds Act. Volatility p.a.
DETAILS as at 30 June 2024 PORTFOLIO ALLOCATION
All fees and charges include Vat June 2024 December 2023
Sector Value (R000) % of Fund Value (R000) % of Fund Difference
Formation date: 13 Sep 2011
Basic Materials 200 673 6.48% 210 971 6.75% (0.27)%
Minimum As per platform Energy 28 017 0.90% 28 808 0.92% (0.02)%
Investment: minimum Consumer Discretionary 162 845 5.26% 196 652 6.29% (1.03)%
No of holdings: 121 Financials 219 796 7.10% 221 873 7.10% 0.00%
Industrials 90 315 2.92% 91 902 2.94% (0.02)%
No of unitholders: 72 Real Estate 50 733 1.64% 52 702 1.69% (0.05)%
Original price: 100 Telecommunications 15 800 0.51% 19 330 0.62% (0.11)%
Broker p.a. com (A): 0.81% Specialist Securities 5 861 0.19% 0.19%
Other Regions 157 404 5.08% 157 426 5.03% 0.05%
Annual fee (A): 1.73%
Australia 6 374 0.21% 0.21%
TER (A) 06/24: 1.78% Brazil 14 760 0.48% 10 046 0.32% 0.16%
TER Perf% (A): 0.00% Canada 38 838 1.25% 37 019 1.18% 0.07%
Cayman Islands 16 898 0.55% 0.55%
Fund value: R3.10bn China 3 074 0.10% 0.10%
Risk rating: Medium Denmark 294 0.01% 309 0.01% (0.00)%
PlexCrowns: Europe 5 579 0.18% 5 825 0.19% (0.01)%
Income declaration: 28/02, 31/08 United Kingdom 158 736 5.13% 162 216 5.19% (0.06)%
11 060
14 775
0.36%
0.47%
Germany
(0.12)%
Income payment: 05/03, 05/09 Hong Kong 16 618 0.54% 34 0.00% 0.54%
Netherlands 35 485 1.15% 32 677 1.05% 0.10%
Japan 37 951 1.23% 38 724 1.24% (0.01)%
USA 131 020 4.23% 129 369 4.13% 0.10%
SA Bonds 1 305 865 42.18% 1 289 113 41.23% 0.95%
Money Market 340 169 10.99% 394 915 12.63% (1.64)%
Liquid Assets 41 802 1.35% 32 226 1.03% 0.32%
TOTAL 3 095 993 100.00% 3 126 941 100.00% (0.99)%
TOP HOLDINGS BY VALUE
June 2024 December 2023
Short Name/ Sector Units Value %of Units Value %of
JSE Code Name (000’s) (R ‘000) Fund (000’s) (R ‘000) Fund Difference
R2037 SA Bnds 228 400 187 956 6.07% 253 400 206 720 6.61% (25 000 000)
R2044 SA Bnds 193 000 152 130 4.91% 178 000 138 579 4.43% 15 000 000
R2035 SA Bnds 160 925 141 309 4.56% 185 925 162 421 5.19% (25 000 000)
I2029 SA Bnds 105 700 137 868 4.45% 105 700 136 286 4.36% -
I2025 SA Bnds 62 700 114 236 3.69% 62 700 110 673 3.54% -
I2033 SA Bnds 85 000 104 705 3.38% 75 000 91 581 2.93% 10 000 000
TOTAL 838 205 27.07% 846 259 27.06%
Price History Relative Strength to CPI excl OER
170 1.5
156 1.3
142 1.1
128 0.9
114 0.7
100 0.5
14 | 15 | 16 | 17 | 18 | 19 | 20 | 21 | 22 | 23 14 | 15 | 16 | 17 | 18 | 19 | 20 | 21 | 22 | 23
Profile’s Unit Trusts & Collective Investments — DOMESTIC 295