
Page 295 - Profiles's Unit Trusts & Collective Investments - September 2024
P. 295
PSG Flexible Fund
PSG Flexible Fund
PSG Flexible Fund
Sector: South African—Multi Asset—
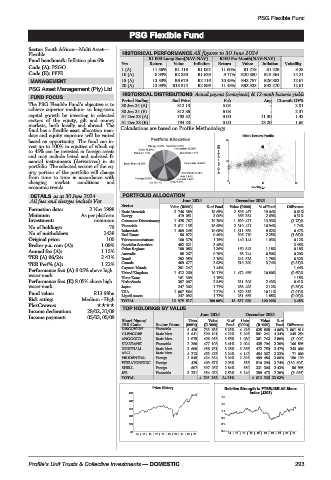
Flexible HISTORICAL PERFORMANCE All figures to 30 June 2024
Fund benchmark: Inflation plus 6% R1 000 Lump Sum(NAV-NAV) R100 Per Month(NAV-NAV)
Code (A): PSGO Yrs Return Value Inflation Return Value Inflation Volatility
Code (E): PFFE 1 (A) 11.56% R1 116 R1 052 11.60% R1 278 R1 229 8.35
10 (A) 8.93% R2 350 R1 629 9.77% R20 380 R15 564 14.21
MANAGEMENT 15 (A) 13.50% R6 679 R2 116 10.49% R43 757 R26 882 12.67
20 (A) 13.93% R13 574 R2 896 11.49% R93 333 R42 270 12.61
PSG Asset Management (Pty) Ltd.
HISTORICAL DISTRIBUTIONS Actual payout (cents/unit) & 12-mnth historic yields
FUND FOCUS
Period Ending End Price Feb Aug 12-mnth DY%
The PSG Flexible Fund’s objective is to 30 Jun 24 (A) 812.13 5.05 - 2.01
achieve superior medium- to long-term 30 Jun 24 (E) 812.86 6.08 - 2.37
capital growth by investing in selected 31 Dec 23 (A) 793.52 0.00 11.30 1.42
sectors of the equity, gilt and money 31 Dec 23 (E) 794.23 0.00 13.20 1.66
markets, both locally and abroad. The
fund has a flexible asset allocation man- Calculations are based on Profile Methodology
date and equity exposure will be varied Risk / Return Profile
based on opportunity. The fund can in- 20
vest up to 100% in equities of which up
to 45% can be invested in foreign assets
and may include listed and unlisted fi-
nancial instruments (derivatives) in its 3yr Compound return(%) 10
portfolio. The selected sectors of the eq-
uity portion of the portfolio will change
from time to time in accordance with
changing market conditions and 0 0 11 22
economic trends. Volatility p.a.
DETAILS as at 30 June 2024 PORTFOLIO ALLOCATION
All fees and charges include Vat June 2024 December 2023
Sector Value (R000) % of Fund Value (R000) % of Fund Difference
Formation date: 2 Nov 1998 Basic Materials 2 746 389 19.65% 2 596 467 19.04% 0.61%
Minimum As per platform Energy 419 051 3.00% 366 354 2.69% 0.31%
Investment: minimum Consumer Discretionary 1 425 767 10.20% 1 899 471 13.93% (3.73)%
No of holdings: 79 Financials 2 611 135 18.68% 2 310 421 16.94% 1.74%
No of unitholders: 2438 Industrials 1 409 245 10.08% 1 311 680 9.62% 0.47%
Real Estate 56 072 0.40% 306 770 2.25% (1.85)%
Original price: 100 Telecommunications 160 378 1.15% 140 144 1.03% 0.12%
Broker p.a. com (A): 1.09% Specialist Securities 482 621 3.45% 3.45%
Other Regions 190 083 1.36% 160 543 1.18% 0.18%
Annual fee (A): 1.15% Australia 98 267 0.70% 68 744 0.50% 0.20%
TER (A) 06/24: 2.41% Brazil 292 959 2.10% 242 526 1.78% 0.32%
TER Perf% (A): 1.22% Canada 409 677 2.93% 510 390 3.74% (0.81)%
Performance fee: (A) 8.05% above high Cayman Islands 201 247 1.44% 1.44%
water mark United Kingdom 1 412 260 10.11% 1 472 666 10.80% (0.69)%
Hong Kong 161 309 1.15% 1.15%
Performance fee: (E) 8.05% above high Netherlands 397 067 2.84% 331 306 2.43% 0.41%
water mark Japan 247 302 1.77% 288 498 2.12% (0.35)%
Fund value: R13.98bn USA 1 007 564 7.21% 1 379 358 10.11% (2.91)%
1.77%
1.85%
251 666
247 092
Risk rating: Medium - High Liquid Assets 13 975 517 100.00% 13 637 029 100.00% (0.08)%
TOTAL
2.48%
PlexCrowns:
Income declaration: 28/02, 31/08 TOP HOLDINGS BY VALUE
June 2024 December 2023
Income payment: 05/03, 05/09
Short Name/ Units Value %of Units Value %of
JSE Code Sector Name (000’s) (R ‘000) Fund (000’s) (R ‘000) Fund Difference
DISCOVERY Financials 5 428 733 635 5.25% 4 426 635 868 4.66% 1 001 916
GLENCORE Basic Mats 5 641 590 191 4.22% 5 295 591 241 4.34% 345 254
ANGGOLD Basic Mats 1 075 496 953 3.56% 1 080 381 742 2.80% (5 000)
STANBANK Financials 2 260 477 108 3.41% 2 094 435 704 3.20% 166 595
NORTHAM Basic Mats 3 609 458 761 3.28% 3 366 472 750 3.47% 243 000
AECI Basic Mats 4 213 453 475 3.24% 4 142 454 367 3.33% 71 000
PRUDENTIAL Foreign 2 545 424 364 3.04% 2 395 499 486 3.66% 150 139
WHEATONPREC Foreign 425 409 677 2.93% 556 510 390 3.74% (130 606)
SHELL Foreign 607 397 067 2.84% 550 331 306 2.43% 56 995
JSE Financials 3 231 354 022 2.53% 3 240 299 473 2.20% (8 935)
TOTAL 4 795 253 34.31% 4 612 326 33.82%
Price History Relative Strength to FTSE/JSE All Share
800 index (J203)
1.5
656
1.3
512
1.1
368
0.9
224 0.7
80 0.5
14 | 15 | 16 | 17 | 18 | 19 | 20 | 21 | 22 | 23 14 | 15 | 16 | 17 | 18 | 19 | 20 | 21 | 22 | 23
Profile’s Unit Trusts & Collective Investments — DOMESTIC 293