
Page 294 - Profiles's Unit Trusts & Collective Investments - September 2024
P. 294
PSG Equity Fund
PSG Equity Fund
PSG Equity Fund
Sector: South African—Equity—General
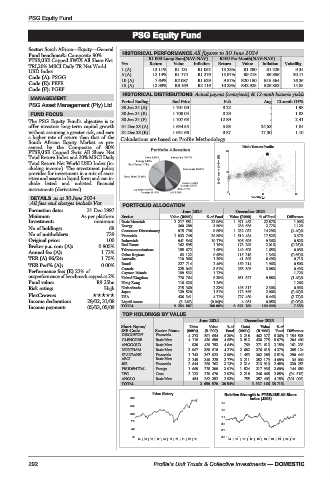
Fund benchmark: Composite 80% HISTORICAL PERFORMANCE All figures to 30 June 2024
FTSE/JSE Capped SWIX All Share Net R1 000 Lump Sum(NAV-NAV) R100 Per Month(NAV-NAV)
TRI,20% MSCI Daily TR Net World Yrs Return Value Inflation Return Value Inflation Volatility
USD Index 1 (A) 13.11% R1 131 R1 052 13.28% R1 290 R1 229 9.34
Code (A): PSGG 5 (A) 12.14% R1 774 R1 276 15.97% R9 218 R6 886 20.17
10 (A) 7.64% R2 087 R1 629 9.57% R20 150 R15 564 16.36
Code (E): PEFE
15 (A) 12.90% R6 169 R2 116 10.29% R42 925 R26 882 14.85
Code (F): PGEF
HISTORICAL DISTRIBUTIONS Actual payout (cents/unit) & 12-mnth historic yields
MANAGEMENT
Period Ending End Price Feb Aug 12-mnth DY%
PSG Asset Management (Pty) Ltd. 30 Jun 24 (A) 1 701.00 9.22 - 1.98
FUND FOCUS 30 Jun 24 (E) 1 700.04 0.29 - 1.03
The PSG Equity Fund’s objective is to 30 Jun 24 (F) 1 707.63 12.89 - 2.41
offer investors long-term capital growth 31 Dec 23 (A) 1 654.55 5.93 24.53 1.84
without assuming a greater risk, and earn 31 Dec 23 (E) 1 651.66 0.87 17.30 1.10
a higher rate of return than that of the Calculations are based on Profile Methodology
South African Equity Market as pre-
sented by the Composite of 80% Risk / Return Profile
FTSE/JSE Capped Swix All Share Net 20
Total Return Index and 20% MSCI Daily
Total Return Net World USD Index (in-
cluding income). The investment policy
provides for investment in a mix of secu- 3yr Compound return(%) 10
rities and assets in liquid form and can in-
clude listed and unlisted financial
instruments (derivatives).
0
0 11 22
DETAILS as at 30 June 2024 Volatility p.a.
All fees and charges include Vat
PORTFOLIO ALLOCATION
Formation date: 31 Dec 1997 June 2024 December 2023
Minimum As per platform Sector Value (R000) % of Fund Value (R000) % of Fund Difference
Investment: minimum Basic Materials 2 217 551 23.96% 1 971 463 22.87% 1.09%
No of holdings: 68 Energy 360 288 3.89% 238 686 2.77% 1.12%
9.89%
915 738
No of unitholders: 739 Consumer Discretionary 1 933 748 20.89% 1 232 032 14.29% (4.40)%
17.52%
Financials
1 510 484
3.37%
Original price: 100 Industrials 941 546 10.17% 806 695 9.36% 0.82%
Broker p.a. com (A): 0.805% Real Estate 162 595 1.76% 173 299 2.01% (0.25)%
Telecommunications 155 672 1.68% 142 605 1.65% 0.03%
Annual fee (A): 1.73%
Other Regions 63 122 0.68% 115 218 1.34% (0.66)%
TER (A) 06/24: 1.75% Australia 110 966 1.20% 41 898 0.49% 0.71%
TER Perf% (A): 0.00% Brazil 227 714 2.46% 169 214 1.96% 0.50%
Canada 325 043 3.51% 265 305 3.08% 0.43%
Performance fee: (E) 23% of Cayman Islands 159 532 1.72% 1.72%
outperformance of benchmark capped at 2% United Kingdom 776 764 8.39% 851 827 9.88% (1.49)%
Fund value: R9.25bn Hong Kong 116 626 1.26% 1.26%
Risk rating: High Netherlands 215 360 2.33% 198 317 2.30% 0.03%
Japan 139 520 1.51% 172 566 2.00% (0.49)%
PlexCrowns: USA 436 341 4.71% 727 489 8.44% (3.72)%
Income declaration: 28/02, 31/08 Liquid Assets (3 249) (0.04)% 4 081 0.05% (0.08)%
Income payment: 05/03, 05/09 TOTAL 9 254 887 100.00% 8 621 189 100.00% 7.35%
TOP HOLDINGS BY VALUE
June 2024 December 2023
Short Name/ Units Value %of Units Value %of
JSE Code Sector Name (000’s) (R ‘000) Fund (000’s) (R ‘000) Fund Difference
DISCOVERY Financials 4 373 591 054 6.39% 3 218 462 377 5.36% 1 154 568
GLENCORE Basic Mats 4 116 430 699 4.65% 3 912 436 775 5.07% 204 400
ANGGOLD Basic Mats 930 429 753 4.64% 769 271 612 3.15% 161 233
NORTHAM Basic Mats 3 067 389 818 4.21% 2 682 376 618 4.37% 385 124
STANBANK Financials 1 743 367 923 3.98% 1 453 302 288 3.51% 290 440
AECI Basic Mats 3 245 349 225 3.77% 3 211 352 179 4.09% 34 000
JSE Financials 2 644 289 762 3.13% 2 314 213 910 2.48% 330 253
PRUDENTIAL Foreign 1 669 278 309 3.01% 1 524 317 936 3.69% 144 680
TFG Cons 2 123 270 676 2.92% 2 218 246 068 2.85% (94 515)
ANGLO Basic Mats 454 262 352 2.83% 755 357 403 4.15% (301 009)
TOTAL 3 659 570 39.54% 3 337 166 38.71%
Price History Relative Strength to FTSE/JSE All Share
1660 index (J203)
1.5
1346
1.3
1032
1.1
718
0.9
404 0.7
90 0.5
14 | 15 | 16 | 17 | 18 | 19 | 20 | 21 | 22 | 23 14 | 15 | 16 | 17 | 18 | 19 | 20 | 21 | 22 | 23
292 Profile’s Unit Trusts & Collective Investments — DOMESTIC