
Page 296 - Profiles's Unit Trusts & Collective Investments - September 2024
P. 296
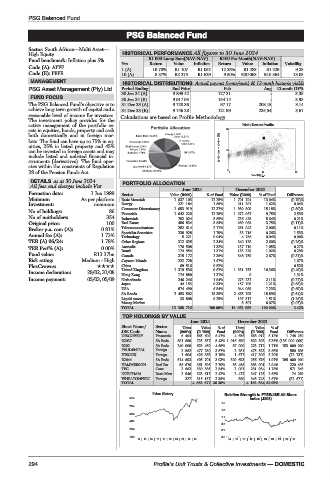
PSG Balanced Fund

                                     PSG Balanced Fund
         PSG Balanced Fund
         Sector: South African—Multi Asset—
         High Equity                HISTORICAL PERFORMANCE All figures to 30 June 2024
         Fund benchmark: Inflation plus 5%  R1 000 Lump Sum(NAV-NAV)  R100 Per Month(NAV-NAV)
         Code (A): APFF            Yrs     Return  Value  Inflation  Return  Value  Inflation  Volatility
         Code (E): PBFE            1 (A)    10.70%  R1 107  R1 052  12.26%  R1 283  R1 229  9.28
                                   10 (A)    8.57%  R2 275  R1 629  9.50%  R20 063  R15 564  13.05
          MANAGEMENT
                                    HISTORICAL DISTRIBUTIONS Actual payout (cents/unit) & 12-mnth historic yields
         PSG Asset Management (Pty) Ltd.  Period Ending  End Price  Feb     Aug  12-mnth DY%
                                   30 Jun 24 (A)  9 899.42     127.31        -       3.39
          FUND FOCUS
                                   30 Jun 24 (E)  9 917.95     154.14        -       3.93
         The PSG Balanced Fund’s objective is to  31 Dec 23 (A)  9 728.36  97.17  208.15  3.14
         achieve long-term growth of capital and a  31 Dec 23 (E)  9 746.28  121.99  235.54  3.67
         reasonable level of income for investors.  Calculations are based on Profile Methodology
         The investment policy provides for the
         active management of the portfolio as-                       Risk / Return Profile
         sets in equities, bonds, property and cash              20
         both domestically and in foreign mar-
         kets. The fund can have up to 75% in eq-
         uities, 25% in listed property and 45%                3yr Compound return(%)
         can be invested in foreign assets and may               10
         include listed and unlisted financial in-
         struments (derivatives). The fund oper-
         ates within the constraints of Regulation
         28 of the Pension Funds Act.                            0 0       11       22
                                                                        Volatility p.a.
          DETAILS as at 30 June 2024
          All fees and charges include Vat  PORTFOLIO ALLOCATION
                                                     June 2024      December 2023
         Formation date:   1 Jun 1999  Sector    Value (R000)  % of Fund  Value (R000)  % of Fund  Difference
         Minimum        As per platform  Basic Materials  1 637 103  12.25%  1 701 794  13.04%  (0.79)%
         Investment:       minimum  Energy         221 184   1.65%  211 291  1.62%  0.04%
         No of holdings:        86  Consumer Discretionary  1 653 919  12.37%  1 980 809  15.18%  (2.80)%
                                   Financials     1 642 226  12.28%  1 272 967  9.75%  2.53%
         No of unitholders:    354  Industrials    782 024   5.85%  736 429  5.64%  0.21%
         Original price:       100  Real Estate    486 834   3.64%  489 064  3.75%  (0.11)%
         Broker p.a. com (A):  0.81%  Telecommunications  282 614  2.11%  261 042  2.00%  0.11%
                                                                     33 716
                                   Specialist Securities
                                                   238 928
                                                             1.79%
                                                                            0.26%
                                                                                    1.53%
         Annual fee (A):      1.73%  Technology     5 221    0.04%   4 786  0.04%   0.00%
         TER (A) 06/24:       1.78%  Other Regions  312 635  2.34%  340 128  2.60%  (0.26)%
         TER Perf% (A):       0.00%  Australia     176 508   1.32%  137 710  1.05%  0.27%
                                                                                    0.29%
         Fund value:       R13.37bn  Brazil        174 954   1.31%  133 229  1.02%  (0.31)%
                                                                            2.67%
                                                                    348 759
                                                             2.36%
                                                   315 172
                                   Canada
         Risk rating:   Medium - High  Cayman Islands  222 728  1.67%               1.67%
         PlexCrowns:               China            69 516   0.52%                  0.52%
                                   United Kingdom  1 319 536  9.87%  1 351 753  10.36%  (0.49)%
         Income declaration:  28/02, 31/08  Hong Kong  174 880  1.31%   0           1.31%
         Income payment:  05/03, 05/09  Netherlands  246 246  1.84%  275 237  2.11%  (0.27)%
                                   Japan            44 153   0.33%  157 705  1.21%  (0.88)%
                                   USA             874 490   6.54%  944 089  7.23%  (0.69)%
                                   SA Bonds       2 453 502  18.35%  2 465 793  18.89%  (0.54)%
                                   Liquid Assets    33 808   0.25%  197 517  1.51%  (1.26)%
                                   Money Market                      8 501  0.07%  (0.07)%
                                   TOTAL          13 368 716  100.00%  13 052 885  100.00%  2.42%
                                    TOP HOLDINGS BY VALUE
                                                       June 2024    December 2023
                                   Short Name/  Sector  Units  Value  %of  Units  Value  %of
                                   JSE Code  Name   (000’s)  (R ‘000)  Fund  (000’s)  (R ‘000)  Fund  Difference
                                   DISCOVERY  Financials  6 404  865 609  6.47%  4 656  668 917  5.12%  1 748 250
                                   R2037     SA Bnds  881 680  725 557  5.43% 1 016 680  829 393  6.35% (135 000 000)
                                   R202      SA Bnds  240 000  623 459  4.66%  87 000  223 712  1.71%  153 000 000
                                   PRUDENTIAL  Foreign  2 862  477 230  3.57%  2 281  475 823  3.65%  580 605
                                   HISCOX    Foreign  1 604  426 368  3.19%  1 677  417 309  3.20%  (72 737)
                                   R2044     SA Bnds  514 693  405 701  3.03%  329 693  256 676  1.97%  185 000 000
                                   HAMMERSON  Real Est  56 676  361 596  2.70%  56 456  383 901  2.94%  220 435
                                   TFG       Cons   2 662  339 385  2.54%  2 091  231 984  1.78%  571 348
                                   NORTHAM   Basic Mats  2 546  323 617  2.42%  2 472  347 125  2.66%  74 289
                                   WHEATONPREC  Foreign  327  315 157  2.36%  380  348 743  2.67%  (52 671)
                                   TOTAL               4 863 677 36.38%  4 183 584 32.05%
                                            Price History       Relative Strength to FTSE/JSE All Share
                                      9730                             index (J203)
                                                                1.5
                                      7984
                                                                1.3
                                      6238
                                                                1.1
                                      4492
                                                                0.9
                                      2746                      0.7
                                      1000                      0.5
                                        14 | 15 | 16 | 17 | 18 | 19 | 20 | 21 | 22 | 23  14 | 15 | 16 | 17 | 18 | 19 | 20 | 21 | 22 | 23
         294                                Profile’s Unit Trusts & Collective Investments — DOMESTIC