
Page 271 - Profile's Unit Trusts & Collective Investments - September 2025
P. 271
Domestic funds Alusi RealFin Managed Fund
Alusi RealFin Managed Fund
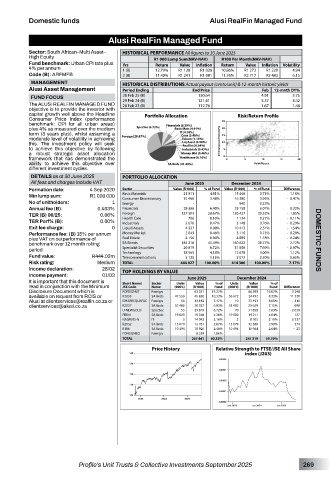
Sector: South African–Multi Asset– HISTORICAL PERFORMANCE All figures to 30 June 2025
High Equity R1 000 Lump Sum(NAV-NAV) R100 Per Month(NAV-NAV)
Fund benchmark: Urban CPI rate plus Yrs Return Value Inflation Return Value Inflation Volatility
4% per annum 1 (B) 12.79% R1 128 R1 028 10.86% R1 273 R1 220 4.94
Code (B): ARFMFB 2 (B) 11.40% R1 241 R1 081 11.76% R2 717 R2 483 6.15
MANAGEMENT HISTORICAL DISTRIBUTIONS Actual payout (cents/unit) & 12-month historic yields
Alusi Asset Management Period Ending End Price Feb 12-mnth DY%
28 Feb 25 (B) 130.64 4.91 3.75
FUND FOCUS 29 Feb 24 (B) 121.41 5.37 4.42
The ALUSI REALFIN MANAGED FUND 28 Feb 23 (B) 112.76 1.67 1.48
objective is to provide the investor with
capital growth well above the Headline Portfolio Allocation Risk/Return Profile
Consumer Price Index (performance
benchmark: CPI for all urban areas)
plus 4% as measured over the medium
term (3 years plus), whilst assuming a
moderate level of volatility in achieving
this. The investment policy will seek
to achieve this objective by following
a robust strategic asset allocation
framework that has demonstrated the
ability to achieve this objective over
different investment cycles.
DETAILS as at 30 June 2025 PORTFOLIO ALLOCATION
All fees and charges include VAT June 2025 December 2024
Formation date: 4 Sep 2020 Sector Value (R ‘000) % of Fund Value (R ‘000) % of Fund Difference
1.18%
Min lump sum: R1 000 000 Basic Materials 21 811 4.91% 15 468 3.73% - 0.47%
15 466
3.95%
16 380
3.48%
Consumer Discretionary
No of unitholders: 1 Energy - - 940 0.23% -
Annual fee (B): 0.403% Financials 28 396 6.40% 25 158 6.07% 0.32%
TER (B) 06/25: 0.06% Foreign 127 303 28.67% 126 427 30.52% - 1.85%
706
TER Perf% (B): 0.00% Health Care 2 076 0.16% 1 134 0.27% - 0.11%
- 0.29%
3 148
0.76%
0.47%
Industrials
Exit fee charge: 0 Liquid Assets 4 337 0.98% 10 413 2.51% - 1.54%
Performance fee: (B) 15% per annum Money Market 2 049 0.46% 3 116 0.75% - 0.29%
plus VAT on outperformance of Real Estate 4 156 0.94% 4 889 1.18% - 0.24% DOMESTIC FUNDS
benchmark over 12 month rolling SA Bonds 184 216 41.49% 160 622 38.77% 2.72%
period Specialist Securities 29 819 6.72% 31 858 7.69% - 0.97%
12 678
4.18%
18 565
3.06%
Technology
1.12%
Fund value: R444.03m Telecommunications 5 125 1.15% 2 073 0.50% 0.65%
Risk rating: Medium TOTAL 444 027 100.00% 414 306 100.00% 7.17%
Income declaration: 28/02 TOP HOLDINGS BY VALUE
Income payment: 01/03 June 2025 December 2024
It is important that this document is Short Name/ Sector Units Value % of Units Value % of
read in conjunction with the Minimum JSE Code Name (000’s) (R ‘000) Fund (000’s) (R ‘000) Fund Difference
Disclosure Document which is FOREIGNUT Foreign - 63 351 14.27% - 66 599 16.07% - 3 248
available on request from RCIS or R2035 SA Bnds 47 559 45 830 10.32% 36 672 34 492 8.33% 11 338
Alusi at clientservices@realfin.co.za or ISHARESQUAFAC Foreign 10 33 183 7.47% 10 33 493 8.08% - 310
clientservices@alusi.co.za R2037 SA Bnds 33 482 30 327 6.83% 33 482 29 629 7.15% 698
U-NEWGOLD SpecSec 55 29 819 6.72% 70 31 858 7.69% - 2 039
FRB41 SA Bnds 19 000 19 348 4.36% 19 000 19 211 4.64% 137
NASPERS-N IT 3 14 042 3.16% 2 8 705 2.10% 5 337
R2032 SA Bnds 13 079 12 761 2.87% 13 079 12 388 2.99% 374
R186 SA Bnds 10 494 10 920 2.46% 10 494 10 944 2.64% - 23
FOREIGNEQ Foreign - 8 259 1.86% - - - -
TOTAL 267 841 60.33% 247 319 59.70%
Price History Relative Strength to FTSE/JSE All Share
index (J203)
Profile’s Unit Trusts & Collective Investments September 2025 269