
Page 269 - Profile's Unit Trusts & Collective Investments - September 2025
P. 269
Hedge Funds Novare Mayibentsha Focused Qualified Fund of Hedge Funds - B3
Novare Mayibentsha Focused Qualified Fund of Hedge Funds - B3
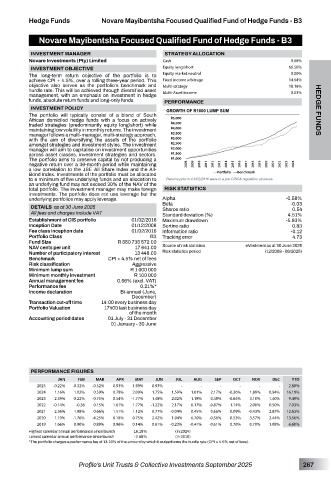
INVESTMENT MANAGER STRATEGY ALLOCATION
Novare Investments (Pty) Limited Cash 0.68%
INVESTMENT OBJECTIVE Equity long/short 66.50%
The long-term return objective of the portfolio is to Equity market neutral 0.00%
achieve CPI + 4.5%, over a rolling three-year period. This Fixed income arbitrage 14.64%
objective also serves as the portfolio’s benchmark and Multi-strategy 18.16%
hurdle rate. This will be achieved through diversified asset Multi-Asset Income 0.03%
management, with an emphasis on investment in hedge
funds, absolute return funds and long-only funds.
PERFORMANCE
INVESTMENT POLICY HEDGE FUNDS
The portfolio will typically consist of a blend of South
African domiciled hedge funds with a focus on actively
traded strategies (predominantly equity long/short) while
maintaining low volatility in monthly returns. The investment
manager follows a multi-manager, multi-strategy approach,
with the aim of diversifying the assets of the portfolio
amongst strategies and investment styles. The investment
manager will aim to capitalise on investment opportunities
across asset classes, investment strategies and sectors.
The portfolio aims to preserve capital by not producing a
negative return over a 36-month period while maintaining
a low correlation to the JSE All Share Index and the All-
Bond Index. Investments of the portfolio must be allocated
to a minimum of five underlying funds and an allocation to
an underlying fund may not exceed 30% of the NAV of the
total portfolio. The investment manager may make foreign RISK STATISTICS
investments. The portfolio does not use leverage but the
underlying portfolios may apply leverage. Alpha -0.58%
DETAILS as at 30 June 2025 Beta -0.03
Sharpe ratio
0.54
All fees and charges include VAT Standard deviation (%) 4.51%
Establishment of CIS portfolio 01/02/2016 Maximum drawdown -5.93%
Inception Date 01/12/2008 Sortino ratio 0.83
Fee class inception date 01/02/2016 Information ratio -0.12
Portfolio Class B3 Tracking error 4.73
Fund Size R 550 735 572.00
NAV cents per unit 17 641.00 Source of risk statistics eVestment as at 30 June 2025
Number of participatory interest 13 448.00 Risk statistics period (12/2008 - 06/2025)
Benchmark CPI + 4.5% net of fees
Risk classification Aggressive
Minimum lump sum R 1 000 000
Minimum monthly investment R 100 000
Annual management fee 0.56% (excl. VAT)
Performance fee 0.21%*
Income declaration Bi-annual (June,
December)
Transaction cut-off time 14:00 every business day
Portfolio Valuation 17h00 last business day
of the month
Accounting period dates 01 July - 31 December
01 January - 30 June
PERFORMANCE FIGURES
JAN FEB MAR APR MAY JUN JUL AUG SEP OCT NOV DEC YTD
2025 -0.22% -0.32% -0.52% 0.93% 1.99% 0.93% - - - - - - 2.80%
2024 1.16% 1.02% 0.59% 0.78% 2.00% 1.75% 1.59% 1.61% 2.17% -0.36% 1.89% 0.94% 16.19%
2023 2.39% -0.22% -0.75% 0.54% -1.77% 1.48% 2.02% 1.18% 0.48% -0.64% 3.10% 1.40% 9.49%
2022 -0.14% -0.38 0.15% 1.61% 1.77% -1.22% 2.17% 0.17% -0.87% 1.14% 2.00% 0.50% 7.03%
2021 2.36% 1.98% 0.66% 1.51% 1.12% 0.77% -0.04% 0.45% 0.66% 0.09% -0.43% 2.87% 12.63%
2020 1.19% -1.76% -4.25% 6.18% 0.75% 2.42% 1.94% 0.70% -0.56% 0.53% 3.57% 2.44% 13.56%
2019 1.66% 0.90% 0.89% 0.96% 0.14% 0.61% -0.23% -0.41% -0.61% 0.76% 0.70% 1.08% 6.60%
Highest calendar annual performance since launch 16.19% (in 2024)
Lowest calendar annual performance since launch -2.88% (in 2016)
*The portfolio charges a performance fee of 13.16% of the amount by which it outperforms the hurdle rate (CPI + 4.5% net of fees).
Profile’s Unit Trusts & Collective Investments September 2025 267