
Page 264 - Profile's Unit Trusts & Collective Investments - September 2025
P. 264
Mazi NCIS Long Short Qualified Hedge Fund Hedge funds
Mazi NCIS Long Short Qualified Hedge Fund
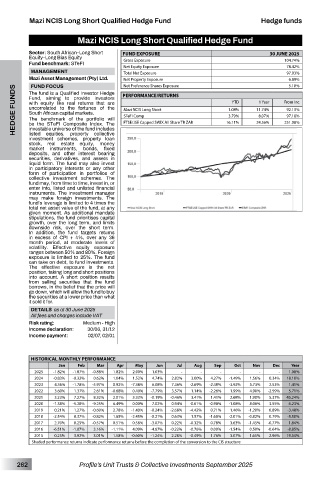
Sector: South African–Long Short FUND EXPOSURE 30 JUNE 2025
Equity–Long Bias Equity Gross Exposure 104.74%
Fund benchmark: STeFI
Net Equity Exposure 78.42%
MANAGEMENT Total Net Exposure 97.03%
Mazi Asset Management (Pty) Ltd. Net Property Exposure 6.89%
Net Preference Shares Exposure
5.10%
FUND FOCUS
HEDGE FUNDS Fund, aiming to provide investors PERFORMANCE/RETURNS 16.11% 11.74% From Inc
The fund is a Qualified Investor Hedge
YTD
1 Year
with equity like real returns that are
uncorrelated to the fortunes of the
1.08%
Mazi NCIS Long Short
92.13%
South African capital markets.
8.07%
97.18%
STeFI Comp
3.79%
The benchmark of the portfolio will
24.56%
be the STeFI Composite Index. The
251.08%
FTSE/JSE Capped SWIX All Share TR ZAR
investable universe of the fund includes
listed equities, property collective
investment schemes, property loan
stock, real estate equity, money
market instruments, bonds, fixed
deposits, and other interest bearing
securities, derivatives, and assets in
liquid form. The fund may also invest
in participatory interests or any other
form of participation in portfolios of
collective investment schemes. The
fund may, from time to time, invest in, or
enter into, listed and unlisted financial
instruments. The investment manager
may make foreign investments. The
fund’s leverage is limited to 4 times the
total net asset value of the fund, at any
given moment. As additional mandate
stipulations, the fund prioritises capital
growth, over the long term, and limits
downside risk, over the short term.
In addition, the fund targets returns
in excess of CPI + 4%, over any 36
month period, at moderate levels of
volatility. Effective equity exposure
ranges between 50% and 80%. Foreign
exposure is limited to 25%. The fund
can take on debt, to fund investments.
The effective exposure is the net
position, taking long and short positions
into account. A short position results
from selling securities that the fund
borrows, in the belief that the price will
go down, which will allow the fund to buy
the securities at a lower price than what
it sold it for.
DETAILS as at 30 June 2025
All fees and charges include VAT
Risk rating: Medium - High
Income declaration: 30/06, 31/12
Income payment: 02/07, 02/01
HISTORICAL MONTHLY PERFORMANCE
Jan Feb Mar Apr May Jun Jul Aug Sep Oct Nov Dec Year
2025 -1.82% -1.87% -0.88% 1.82% 2.90% 1.03% - - - - - - 1.08%
2024 -0.83% -0.32% 0.62% 1.04% 1.52% 4.74% 2.82% 3.00% 4.27% -1.49% 1.56% 0.34% 18.10%
2023 4.36% -1.78% -5.97% 0.92% -7.38% 6.08% 7.36% -2.69% -2.48% -3.92% 5.73% 2.53% 1.41%
2022 3.60% 1.37% 2.61% -0.68% 0.40% -7.79% 3.57% 1.14% -2.26% 1.99% 4.90% -2.59% 5.71%
2021 3.23% 7.27% 8.32% 2.01% 3.33% -0.19% -0.46% 3.41% 1.41% 2.68% 1.90% 5.37% 45.24%
2020 -1.38% -5.28% -9.25% 6.49% 0.00% 7.02% 0.94% -0.61% -0.98% -1.08% 8.06% 3.55% 6.23%
2019 0.21% 1.27% -0.69% 2.78% -1.40% -0.24% -2.68% -4.42% 0.71% 1.46% -1.20% 0.89% -3.48%
2018 -2.54% 0.37% -0.82% 1.65% -2.45% -0.21% 0.63% 1.57% -1.68% -2.01% -0.82% 0.79% -5.50%
2017 2.70% 0.25% -0.57% 0.51% 0.58% -3.07% 0.22% -0.32% 0.78% 3.63% -1.45% -0.77% 1.84%
2016 -6.51% -1.07% 3.16% -1.11% 4.09% -4.67% -0.22% -0.76% 0.00% -1.54% 0.50% -0.64% -8.85%
2015 0.25% 3.92% 3.01% 1.58% -0.60% -1.24% 2.28% -0.49% 1.76% 3.07% 1.65% 2.96% 19.54%
Shaded performance returns indicate performance returns before the completion of the conversion to the CIS structure
262 Profile’s Unit Trusts & Collective Investments September 2025