
Page 261 - Profile's Unit Trusts & Collective Investments - September 2025
P. 261
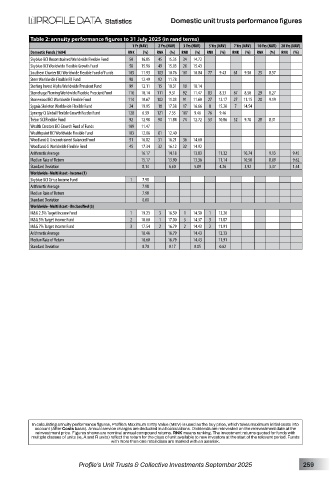
Domestic unit trusts performance figures

          Table 2: annuity performance figures to 31 July 2025 (in rand terms)
                                       1 Yr (NAV)  2 Yrs (NAV)  3 Yrs (NAV)  5 Yrs (NAV)  7 Yrs (NAV)  10 Yrs (NAV)  20 Yrs (NAV)
          Domestic Funds (1604)      RNK  (%)  RNK  (%)  RNK  (%)  RNK  (%)  RNK  (%)  RNK  (%)  RNK  (%)
          Skyblue BCI Unconstrained Worldwide Flexible Fund  50  16.85  45  15.35  34  14.72
          Skyblue BCI Worldwide Flexible Growth Fund  58  15.96  49  15.03  26  15.43
          Southern Charter BCI Worldwide Flexible Fund of Funds  105  11.93  103  10.76  101  10.84  77  9.43  61  9.50  25  8.57
          Steer Worldwide Flexible FR Fund  98  12.49  92  11.78
          Sterling Invest Alpha Worldwide Prescient Fund  99  12.11  15  18.31  10  18.14
          Stonehage Fleming Worldwide Flexible Prescient Fund  116  10.14  111  9.31  92  11.47  83  8.33  67  8.50  29  8.27
          Stonewood BCI Worldwide Flexible Fund  114  10.67  102  11.03  91  11.60  27  12.17  27  11.15  20  9.19
          Sygnia Skeleton Worldwide Flexible Fund  24  19.95  18  17.38  17  16.66  8  15.20  7  14.54
          Synergy Ci Global Flexible Growth Feeder Fund  128  6.39  121  7.35  107  9.46  76  9.46
          Trésor SCI Flexible Fund    92  12.98  90  11.84  74  12.72  53  10.86  52  9.78  28  8.31
          Wealth Creators BCI Growth Fund of Funds  109  11.47
          Wealthpoint BCI Worldwide Flexible Fund  103  12.06  81  12.40
          Woodland Ci Unconstrained Balanced Fund  51  16.82  31  16.21  36  14.60
          Woodland Ci Worldwide Flexible Fund  45  17.34  32  16.12  32  14.92
          Arithmetic Average             16.17   14.18  13.83  11.32  10.74   9.13  9.45
          Median Rate of Return          15.17   13.90  13.36  11.14  10.50   8.89  9.62
          Standard Deviation             8.14    6.60   5.89   4.26    3.92   3.37  1.44
          Worldwide–Multi Asset–Income (1)
          Skyblue BCI Cirrus Income Fund  1  7.98
          Arithmetic Average             7.98
          Median Rate of Return          7.98
          Standard Deviation             0.00
          Worldwide–Multi Asset–Unclassified (3)
          M&G 2.5% Target Income Fund  1  19.23  3  16.59  1  14.50  1  13.20
          M&G 5% Target Income Fund   2  18.60  1  17.00  3  14.37  3  11.87
          M&G 7% Target Income Fund   3  17.54  2  16.79  2  14.43  2  11.91
          Arithmetic Average             18.46   16.79  14.43  12.33
          Median Rate of Return          18.60   16.79  14.43  11.91
          Standard Deviation             0.70    0.17   0.05   0.62


          In calculating annuity performance figures, Profile’s Maximum Entry Value (MEV) is used as the buy price, which takes maximum initial costs into
           account (After Costs basis). Annual service charges are deducted in all calculations. Dividends are reinvested on the reinvestment date at the
           reinvestment price. Figures shown are nominal annual compound returns. RNK means ranking. The investment returns quoted for funds with
          multiple classes of units (ie, A and R units) reflect the return for the class of unit available to new investors at the start of the relevant period. Funds
                                 with more than one retail class are marked with an asterisk.

                       Profile’s Unit Trusts & Collective Investments September 2025   259