
Page 116 - Profile's Unit Trusts & Collective Investments - September 2025
P. 116
Chapter 6 Investment risk
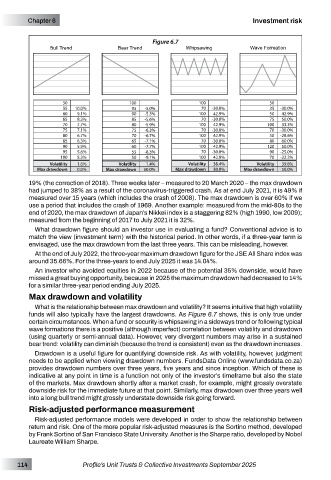
Figure 6.7
Bull Trend Bear Trend Whipsawing Wave Formation
50 100 100 50
55 10.0% 95 -5.0% 70 -30.0% 35 -30.0%
60 9.1% 90 -5.3% 100 42.9% 50 42.9%
65 8.3% 85 -5.6% 70 -30.0% 75 50.0%
70 7.7% 80 -5.9% 100 42.9% 100 33.3%
75 7.1% 75 -6.3% 70 -30.0% 70 -30.0%
80 6.7% 70 -6.7% 100 42.9% 50 -28.6%
85 6.3% 65 -7.1% 70 -30.0% 80 60.0%
90 5.9% 60 -7.7% 100 42.9% 120 50.0%
95 5.6% 55 -8.3% 70 -30.0% 90 -25.0%
100 5.3% 50 -9.1% 100 42.9% 70 -22.2%
Volatility 1.6% Volatility 1.4% Volatility 38.4% Volatility 39.8%
Max drawdown 0.0% Max drawdown 50.0% Max drawdown 30.0% Max drawdown 50.0%
19% (the correction of 2018). Three weeks later – measured to 20 March 2020 – the max drawdown
had jumped to 38% as a result of the coronavirus-triggered crash. As at end July 2021, it is 49% if
measured over 15 years (which includes the crash of 2008). The max drawdown is over 60% if we
use a period that includes the crash of 1969. Another example: measured from the mid-80s to the
end of 2020, the max drawdown of Japan’s Nikkei index is a staggering 82% (high 1990, low 2009);
measured from the beginning of 2017 to July 2021 it is 32%.
What drawdown figure should an investor use in evaluating a fund? Conventional advice is to
match the view (investment term) with the historical period. In other words, if a three-year term is
envisaged, use the max drawdown from the last three years. This can be misleading, however.
At the end of July 2022, the three-year maximum drawdown figure for the JSE All Share index was
around 35.66%. For the three-years to end July 2025 it was 14.04%.
An investor who avoided equities in 2022 because of the potential 35% downside, would have
missed a great buying opportunity, because in 2025 the maximum drawdown had decreased to 14%
for a similar three-year period ending July 2025.
Max drawdown and volatility
What is the relationship between max drawdown and volatility? It seems intuitive that high volatility
funds will also typically have the largest drawdowns. As Figure 6.7 shows, this is only true under
certain circumstances. When a fund or security is whipsawing in a sideways trend or following typical
wave formations there is a positive (although imperfect) correlation between volatility and drawdown
(using quarterly or semi-annual data). However, very divergent numbers may arise in a sustained
bear trend: volatility can diminish (because the trend is consistent) even as the drawdown increases.
Drawdown is a useful figure for quantifying downside risk. As with volatility, however, judgment
needs to be applied when viewing drawdown numbers. FundsData Online (www.fundsdata.co.za)
provides drawdown numbers over three years, five years and since inception. Which of these is
indicative at any point in time is a function not only of the investor’s timeframe but also the state
of the markets. Max drawdown shortly after a market crash, for example, might grossly overstate
downside risk for the immediate future at that point. Similarly, max drawdown over three years well
into a long bull trend might grossly understate downside risk going forward.
Risk-adjusted performance measurement
Risk-adjusted performance models were developed in order to show the relationship between
return and risk. One of the more popular risk-adjusted measures is the Sortino method, developed
by Frank Sortino of San Francisco State University. Another is the Sharpe ratio, developed by Nobel
Laureate William Sharpe.
114 Profile’s Unit Trusts & Collective Investments September 2025