
Page 115 - Profile's Unit Trusts & Collective Investments - September 2025
P. 115
Investment risk Chapter 6
but is, on average, less risky than equity sectors. Figure 6.5: Risk/return profile
General equity funds have a higher average
volatility than Multi Asset sectors but, typically, a
lower average than theme funds.
In short, the greater the equity component,
and the more narrowly focussed that equity
component, the greater the volatility. While a
useful rule of thumb, it must be remembered that
there are many exceptions to this principle.
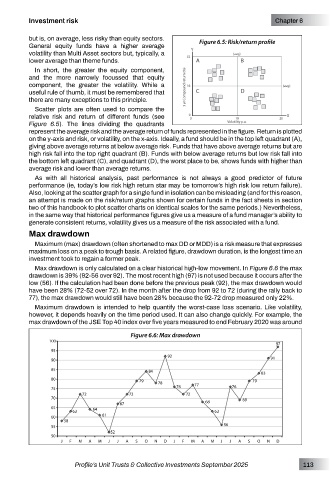
Scatter plots are often used to compare the
relative risk and return of different funds (see
Figure 6.5). The lines dividing the quadrants
represent the average risk and the average return of funds represented in the figure. Return is plotted
on the y-axis and risk, or volatility, on the x-axis. Ideally, a fund should be in the top left quadrant (A),
giving above average returns at below average risk. Funds that have above average returns but are
high risk fall into the top right quadrant (B). Funds with below average returns but low risk fall into
the bottom left quadrant (C), and quadrant (D), the worst place to be, shows funds with higher than
average risk and lower than average returns.
As with all historical analysis, past performance is not always a good predictor of future
performance (ie, today’s low risk high return star may be tomorrow’s high risk low return failure).
Also, looking at the scatter graph for a single fund in isolation can be misleading (and for this reason,
an attempt is made on the risk/return graphs shown for certain funds in the fact sheets in section
two of this handbook to plot scatter charts on identical scales for the same periods.) Nevertheless,
in the same way that historical performance figures give us a measure of a fund manager’s ability to
generate consistent returns, volatility gives us a measure of the risk associated with a fund.
Max drawdown
Maximum (max) drawdown (often shortened to max DD or MDD) is a risk measure that expresses
maximum loss on a peak to trough basis. A related figure, drawdown duration, is the longest time an
investment took to regain a former peak.
Max drawdown is only calculated on a clear historical high-low movement. In Figure 6.6 the max
drawdown is 39% (92-56 over 92). The most recent high (97) is not used because it occurs after the
low (56). If the calculation had been done before the previous peak (92), the max drawdown would
have been 28% (72-52 over 72). In the month after the drop from 92 to 72 (during the rally back to
77), the max drawdown would still have been 28% because the 92-72 drop measured only 22%.
Maximum drawdown is intended to help quantify the worst-case loss scenario. Like volatility,
however, it depends heavily on the time period used. It can also change quickly. For example, the
max drawdown of the JSE Top 40 index over five years measured to end February 2020 was around
Figure 6.6: Max drawdown
Profile’s Unit Trusts & Collective Investments September 2025 113