
Page 113 - Profile's Unit Trusts & Collective Investments - September 2025
P. 113
Investment risk Chapter 6
Table 6.1 Figure 6.2: Risky Co. Ltd.
Risky Co. Ltd. Stable Co. Ltd.
% return for % return for
Period period period
1 16.36 14.48
2 15.05 15.4
3 16.55 13.92
4 15.34 14.92
5 18.78 14.95
6 13.46 13.89
7 12.12 14.31 Figure 6.3: Stable Co. Ltd.
8 12.82 16.17
9 15.96 15.05
10 16.86 14.7
11 12.15 14.37
12 11.7 14.27
13 17.31 16.14
14 15.65 15.9
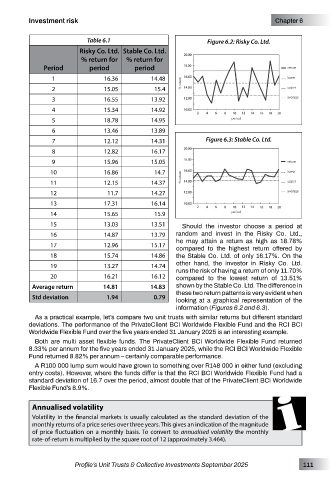
15 13.03 13.51 Should the investor choose a period at
16 14.87 13.79 random and invest in the Risky Co. Ltd.,
17 12.96 15.17 he may attain a return as high as 18.78%
compared to the highest return offered by
18 15.74 14.86 the Stable Co. Ltd. of only 16.17%. On the
19 13.27 14.74 other hand, the investor in Risky Co. Ltd.
runs the risk of having a return of only 11.70%
20 16.21 16.12 compared to the lowest return of 13.51%
Average return 14.81 14.83 shown by the Stable Co. Ltd. The difference in
these two return patterns is very evident when
Std deviation 1.94 0.79 looking at a graphical representation of the
information (Figures 6.2 and 6.3).
As a practical example, let’s compare two unit trusts with similar returns but different standard
deviations. The performance of the PrivateClient BCI Worldwide Flexible Fund and the RCI BCI
Worldwide Flexible Fund over the five years ended 31 January 2025 is an interesting example.
Both are multi asset flexible funds. The PrivateClient BCI Worldwide Flexible Fund returned
8.33% per annum for the five years ended 31 January 2025, while the RCI BCI Worldwide Flexible
Fund returned 8.82% per annum – certainly comparable performance.
A R100 000 lump sum would have grown to something over R148 000 in either fund (excluding
entry costs). However, where the funds differ is that the RCI BCI Worldwide Flexible Fund had a
standard deviation of 16.7 over the period, almost double that of the PrivateClient BCI Worldwide
Flexible Fund’s 8.9%.
Annualised volatility
Volatility in the financial markets is usually calculated as the standard deviation of the
monthly returns of a price series over three years. This gives an indication of the magnitude
of price fluctuation on a monthly basis. To convert to annualised volatility the monthly
rate-of-return is multiplied by the square root of 12 (approximately 3.464).
Profile’s Unit Trusts & Collective Investments September 2025 111