
Page 119 - Profile's Unit Trusts & Collective Investments - September 2025
P. 119
Investment risk Chapter 6
All figures to 31 July 2025
Risk Profile Worksheet scores can be related to volatility figures in fund fact sheets
the identified sectors that have similar volatilities. Or you can look at the volatilities of existing funds
you hold to see how they compare to your adjusted score.
For funds included in this handbook, volatilities are available in the historical performance tables.
The three-year volatility figure is widely accepted as a reasonable measure of historical risk. Or use
the volatility for the period which matches your investment view (five years in the example above).
Note that volatility can shift quickly in times of upheaval. If you are looking at one of the riskier fund
categories, look at volatilities across a range of periods. A sector may have been through a recent
period of stability (a steady trend one way or the other) which may not be indicative of the volatility
changes that could occur.
Using the risk number
The risk numbers calculated from the worksheets try to position you on the risk spectrum (see
Figure 6.8). It does this by quantifying both subjective (risk appetite) and objective (risk capacity)
factors which have a bearing on your ability to tolerate risk, both due to your disposition (risk prone
or risk averse), and due to more objective factors, like your age and personal circumstances.
A high adjusted score (15 and above) means that you are in a position to take on a higher level of
risk. This certainly doesn’t mean that you should take on lots of risk. Rather, it means that if you take
on a riskier investment and suffer the consequences of risk (ie, lose money), you are in a relatively
good position to deal with the situation.
A low adjusted score (below 10) means that you should be cautious about taking on risk.
Again, this doesn’t mean that you should never consider a higher risk investment; rather, it means
that your ability to recover from the blow of a risky investment that fails to perform is not very good.
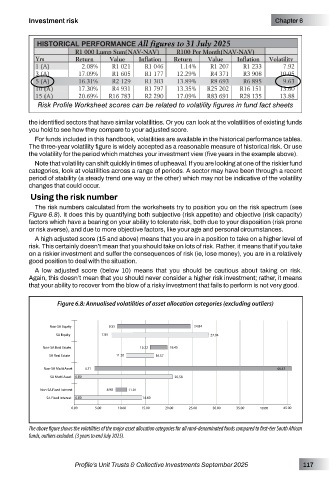
Figure 6.8: Annualised volatilities of asset allocation categories (excluding outliers)
The above figure shows the volatilities of the major asset allocation categories for all rand-denominated funds compared to first-tier South African
funds, outliers excluded. (3 years to end July 2025).
Profile’s Unit Trusts & Collective Investments September 2025 117