
Page 57 - Profile's Unit Trusts & Collective Investments - March 2026
P. 57
Costs and pricing Chapter 3
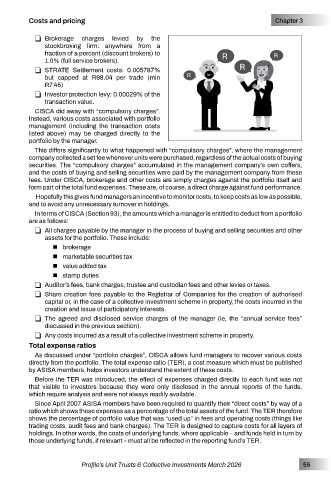
R Brokerage charges levied by the
stockbroking firm: anywhere from a
fraction of a percent (discount brokers) to R
1.0% (full service brokers).
R STRATE Settlement costs: 0.005787% R
but capped at R98.04 per trade (min
R7.45)
R Investor protection levy: 0.00029% of the
transaction value.
CISCA did away with “compulsory charges”.
Instead, various costs associated with portfolio
management (including the transaction costs
listed above) may be charged directly to the
portfolio by the manager.
This differs significantly to what happened with “compulsory charges”, where the management
company collected a set fee whenever units were purchased, regardless of the actual costs of buying
securities. The “compulsory charges” accumulated in the management company’s own coffers,
and the costs of buying and selling securities were paid by the management company from these
fees. Under CISCA, brokerage and other costs are simply charges against the portfolio itself and
form part of the total fund expenses. These are, of course, a direct charge against fund performance.
Hopefully this gives fund managers an incentive to monitor costs, to keep costs as low as possible,
and to avoid any unnecessary turnover in holdings.
In terms of CISCA (Section 93), the amounts which a manager is entitled to deduct from a portfolio
are as follows:
R All charges payable by the manager in the process of buying and selling securities and other
assets for the portfolio. These include:
brokerage
marketable securities tax
value added tax
stamp duties
R Auditor’s fees, bank charges, trustee and custodian fees and other levies or taxes.
R Share creation fees payable to the Registrar of Companies for the creation of authorised
capital or, in the case of a collective investment scheme in property, the costs incurred in the
creation and issue of participatory interests.
R The agreed and disclosed service charges of the manager (ie, the “annual service fees”
discussed in the previous section).
R Any costs incurred as a result of a collective investment scheme in property.
Total expense ratios
As discussed under “portfolio charges”, CISCA allows fund managers to recover various costs
directly from the portfolio. The total expense ratio (TER), a cost measure which must be published
by ASISA members, helps investors understand the extent of these costs.
Before the TER was introduced, the effect of expenses charged directly to each fund was not
that visible to investors because they were only disclosed in the annual reports of the funds,
which require analysis and were not always readily available.
Since April 2007 ASISA members have been required to quantify their “direct costs” by way of a
ratio which shows these expenses as a percentage of the total assets of the fund. The TER therefore
shows the percentage of portfolio value that was “used up” in fees and operating costs (things like
trading costs, audit fees and bank charges). The TER is designed to capture costs for all layers of
holdings. In other words, the costs of underlying funds, where applicable – and funds held in turn by
those underlying funds, if relevant – must all be reflected in the reporting fund’s TER.
Profile’s Unit Trusts & Collective Investments March 2026 55