
Page 220 - Profile's Unit Trusts & Collective Investments - September 2025
P. 220
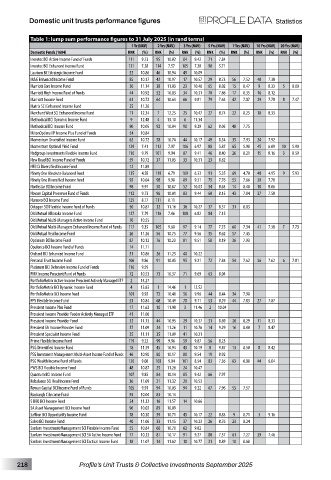
Domestic unit trusts performance figures                              Statistics

          Table 1: lump sum performance figures to 31 July 2025 (in rand terms)
                                      1 Yr (NAV)  2 Yrs (NAV)  3 Yrs (NAV)  5 Yrs (NAV)  7 Yrs (NAV)  10 Yrs (NAV)  20 Yrs (NAV)
          Domestic Funds (1604)      RNK  (%)  RNK  (%)  RNK  (%)  RNK  (%)  RNK  (%)  RNK  (%)  RNK  (%)
          Investec BCI Active Income Fund of Funds  111  9.73  95  10.02  84  9.42  71  7.84
          Investec BCI Enhanced Income Fund  131  7.28  114  7.57  105  7.20  90  5.71
          Laurium BCI Strategic Income Fund  52  10.86  46  10.94  49  10.09
          M&G Enhanced Income Fund    85  10.17  42  10.97  17  10.57  29  8.73  56  7.52  40  7.38
          Marriott Core Income Fund   30  11.14  38  11.03  23  10.48  65  8.02  15  8.47  9  8.33  5  8.00
          Marriott High Income Fund of Funds  44  10.92  52  10.83  34  10.31  70  7.86  17  8.35  16  8.12
          Marriott Income Fund        61  10.72  64  10.64  66  9.81  79  7.63  42  7.87  29  7.78  8  7.47
          Matrix SCI Enhanced Income Fund  25  11.26
          Merchant West SCI Enhanced Income Fund  11  12.34  7  12.25  25  10.47  27  8.74  22  8.25  10  8.33
          Methodical BCI Dynamic Income Fund  9  12.48  4  13.10  6  11.34
          Methodical BCI Income Fund  90  10.05  92  10.04  90  9.29  62  8.05  48  7.75
          MitonOptimal IP Income Plus Fund of Funds  54  10.84
          Momentum Diversified Income Fund  62  10.72  58  10.74  44  10.17  49  8.34  35  7.93  24  7.92
          Momentum Optimal Yield Fund  129  7.41  112  7.97  106  6.97  88  5.87  65  5.98  45  6.09  10  5.90
          Nedgroup Investments Flexible Income Fund  110  9.79  101  9.94  87  9.41  46  8.40  26  8.21  15  8.16  3  8.59
          New Road BCI Income Fund of Funds  59  10.72  37  11.05  33  10.31  23  8.82
          NFB Ci Diversified Income Fund  12  11.89
          Ninety One Absolute Balanced Fund  135  4.58  119  6.79  109  6.33  91  5.35  69  4.70  48  4.95  9  5.93
          Ninety One Diversified Income Fund  92  10.04  98  9.98  89  9.31  75  7.76  53  7.66  30  7.78
          Northstar BCI Income Fund   98  9.97  50  10.87  52  10.03  34  8.63  14  8.48  18  8.06
          Novare Capital Preserver Fund of Funds  112  9.73  96  10.01  83  9.44  60  8.15  43  7.84  37  7.58
          Numoro BCI Income Fund      125  8.17  111  8.11
          Octagon SCI Flexible Income Fund of Funds  50  10.87  32  11.16  36  10.27  37  8.57  31  8.03
          Old Mutual Albaraka Income Fund  127  7.79  116  7.46  108  6.82  84  7.15
          Old Mutual Multi-Managers Active Income Fund  70  10.55
          Old Mutual Multi-Managers Enhanced Income Fund of Funds  117  9.35  105  9.68  97  9.14  77  7.75  60  7.34  41  7.38  7  7.73
          Old Mutual Real Income Fund  26  11.26  56  10.75  77  9.56  35  8.62  57  7.45
          Optimum BCI Income Fund     87  10.12  76  10.23  81  9.51  58  8.19  36  7.93
          Opulence BCI Income Fund of Funds  14  11.71
          Orchard BCI Enhanced Income Fund  51  10.86  26  11.25  40  10.22
          Personal Trust Income Fund  106  9.86  91  10.05  95  9.21  72  7.84  54  7.62  36  7.62  6  7.81
          Platinum BCI Defensive Income Fund of Funds  116  9.59
          PMK Income Prescient Fund of Funds  72  10.53  73  10.37  71  9.69  63  8.04
          PortfolioMetrix Active Income Prescient Actively Managed ETF  2  14.27
          PortfolioMetrix BCI Dynamic Income Fund  4  13.83  1  14.46  1  12.52
          PortfolioMetrix BCI Income Fund  101  9.92  72  10.40  56  9.96  44  8.44  34  7.98
          PPS Flexible Income Fund    53  10.84  68  10.49  70  9.71  53  8.29  44  7.83  27  7.87
          Prescient Income Plus Fund  17  11.62  10  11.98  3  11.46  2  10.04
          Prescient Income Provider Feeder Actively Managed ETF  41  11.06
          Prescient Income Provider Fund  32  11.13  44  10.95  29  10.37  31  8.69  20  8.29  11  8.33
          Prescient SA Income Provider Fund  37  11.09  24  11.26  11  10.76  14  9.29  16  8.40  7  8.47
          Prescient Specialist Income Fund  35  11.11  35  11.09  41  10.21
          Prime Flexible Income Fund  119  9.22  99  9.96  59  9.87  56  8.23
          PSG Diversified Income Fund  18  11.59  45  10.94  43  10.19  8  9.47  13  8.50  8  8.42
          PSG Investment Management Multi-Asset Income Fund of Funds  46  10.90  80  10.17  80  9.54  19  8.92
          PSG Wealth Income Fund of Funds  120  9.08  108  9.04  101  8.54  83  7.36  63  6.80  44  6.84
          PWS BCI Flexible Income Fund  48  10.87  25  11.26  24  10.47
          Quantum BCI Income Fund     107  9.85  84  10.14  85  9.42  66  7.97
          Rebalance SCI Real Income Fund  36  11.09  21  11.32  20  10.53
          Rowan Capital BCI Income Fund of Funds  105  9.91  94  10.03  94  9.22  67  7.96  55  7.57
          Roxburgh Ci Income Fund     93  10.04  83  10.14
          S BRO BCI Income Fund       24  11.32  16  11.57  14  10.66
          SA Asset Management BCI Income Fund  96  10.02  89  10.09
          Saffron BCI Opportunity Income Fund  78  10.30  59  10.71  45  10.17  22  8.83  9  8.71  3  9.16
          Salvo BCI Income Fund       40  11.06  33  11.15  37  10.23  26  8.76  23  8.24
          Sanlam Investment Management SCI Flexible Income Fund  55  10.84  60  10.70  62  9.82
          Sanlam Investment Management SCI SA Active Income Fund  77  10.33  81  10.17  91  9.27  80  7.57  61  7.27  39  7.46
          Sanlam Investment Management SCI Tactical Income Fund  38  11.07  14  11.62  10  10.77  21  8.89  10  8.68


      218               Profile’s Unit Trusts & Collective Investments September 2025