
Page 115 - Profile's Unit Trusts & Collective Investments - March 2026
P. 115
Investment risk Chapter 6
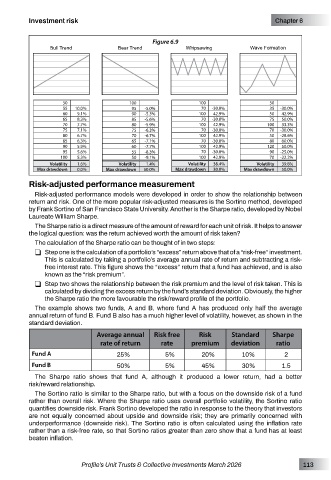
Figure 6.9
Bull Trend Bear Trend Whipsawing Wave Formation
50 100 100 50
55 10.0% 95 -5.0% 70 -30.0% 35 -30.0%
60 9.1% 90 -5.3% 100 42.9% 50 42.9%
65 8.3% 85 -5.6% 70 -30.0% 75 50.0%
70 7.7% 80 -5.9% 100 42.9% 100 33.3%
75 7.1% 75 -6.3% 70 -30.0% 70 -30.0%
80 6.7% 70 -6.7% 100 42.9% 50 -28.6%
85 6.3% 65 -7.1% 70 -30.0% 80 60.0%
90 5.9% 60 -7.7% 100 42.9% 120 50.0%
95 5.6% 55 -8.3% 70 -30.0% 90 -25.0%
100 5.3% 50 -9.1% 100 42.9% 70 -22.2%
Volatility 1.6% Volatility 1.4% Volatility 38.4% Volatility 39.8%
Max drawdown 0.0% Max drawdown 50.0% Max drawdown 30.0% Max drawdown 50.0%
Risk-adjusted performance measurement
Risk-adjusted performance models were developed in order to show the relationship between
return and risk. One of the more popular risk-adjusted measures is the Sortino method, developed
by Frank Sortino of San Francisco State University. Another is the Sharpe ratio, developed by Nobel
Laureate William Sharpe.
The Sharpe ratio is a direct measure of the amount of reward for each unit of risk. It helps to answer
the logical question: was the return achieved worth the amount of risk taken?
The calculation of the Sharpe ratio can be thought of in two steps:
R Step one is the calculation of a portfolio’s “excess” return above that of a “risk-free” investment.
This is calculated by taking a portfolio’s average annual rate of return and subtracting a risk-
free interest rate. This figure shows the “excess” return that a fund has achieved, and is also
known as the “risk premium”.
R Step two shows the relationship between the risk premium and the level of risk taken. This is
calculated by dividing the excess return by the fund’s standard deviation. Obviously, the higher
the Sharpe ratio the more favourable the risk/reward profile of the portfolio.
The example shows two funds, A and B, where fund A has produced only half the average
annual return of fund B. Fund B also has a much higher level of volatility, however, as shown in the
standard deviation.
Average annual Risk free Risk Standard Sharpe
rate of return rate premium deviation ratio
Fund A 25% 5% 20% 10% 2
Fund B 50% 5% 45% 30% 1.5
The Sharpe ratio shows that fund A, although it produced a lower return, had a better
risk/reward relationship.
The Sortino ratio is similar to the Sharpe ratio, but with a focus on the downside risk of a fund
rather than overall risk. Where the Sharpe ratio uses overall portfolio volatility, the Sortino ratio
quantifies downside risk. Frank Sortino developed the ratio in response to the theory that investors
are not equally concerned about upside and downside risk; they are primarily concerned with
underperformance (downside risk). The Sortino ratio is often calculated using the inflation rate
rather than a risk-free rate, so that Sortino ratios greater than zero show that a fund has at least
beaten inflation.
Profile’s Unit Trusts & Collective Investments March 2026 113