
Page 110 - Profile's Unit Trusts & Collective Investments - March 2026
P. 110
Chapter 6 Investment risk
Table 6.1 Figure 6.2: Risky Co. Ltd.
Risky Co. Ltd. Stable Co. Ltd.
% return for % return for
Period period period
1 16.36 14.48
2 15.05 15.4
3 16.55 13.92
4 15.34 14.92
5 18.78 14.95
6 13.46 13.89
7 12.12 14.31 Figure 6.3: Stable Co. Ltd.
8 12.82 16.17
9 15.96 15.05
10 16.86 14.7
11 12.15 14.37
12 11.7 14.27
13 17.31 16.14
14 15.65 15.9
15 13.03 13.51 risk (about a 33% chance) of falling to 92c or
16 14.87 13.79 lower in a month.
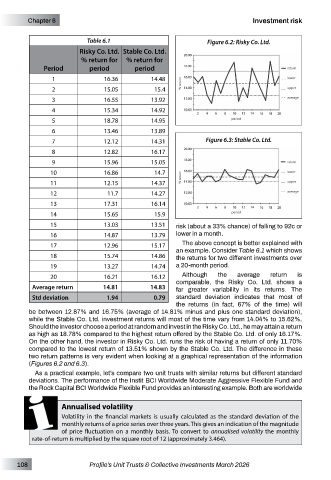
The above concept is better explained with
17 12.96 15.17 an example. Consider Table 6.1 which shows
18 15.74 14.86 the returns for two different investments over
19 13.27 14.74 a 20-month period.
20 16.21 16.12 Although the average return is
comparable, the Risky Co. Ltd. shows a
Average return 14.81 14.83 far greater variability in its returns. The
Std deviation 1.94 0.79 standard deviation indicates that most of
the returns (in fact, 67% of the time) will
be between 12.87% and 16.75% (average of 14.81% minus and plus one standard deviation),
while the Stable Co. Ltd. investment returns will most of the time vary from 14.04% to 15.62%.
Should the investor choose a period at random and invest in the Risky Co. Ltd., he may attain a return
as high as 18.78% compared to the highest return offered by the Stable Co. Ltd. of only 16.17%.
On the other hand, the investor in Risky Co. Ltd. runs the risk of having a return of only 11.70%
compared to the lowest return of 13.51% shown by the Stable Co. Ltd. The difference in these
two return patterns is very evident when looking at a graphical representation of the information
(Figures 6.2 and 6.3).
As a practical example, let’s compare two unit trusts with similar returns but different standard
deviations. The performance of the Instit BCI Worldwide Moderate Aggressive Flexible Fund and
the Rock Capital BCI Worldwide Flexible Fund provides an interesting example. Both are worldwide
Annualised volatility
Volatility in the financial markets is usually calculated as the standard deviation of the
monthly returns of a price series over three years. This gives an indication of the magnitude
of price fluctuation on a monthly basis. To convert to annualised volatility the monthly
rate-of-return is multiplied by the square root of 12 (approximately 3.464).
108 Profile’s Unit Trusts & Collective Investments March 2026