
Page 114 - Profile's Unit Trusts & Collective Investments - March 2026
P. 114
Chapter 6 Investment risk
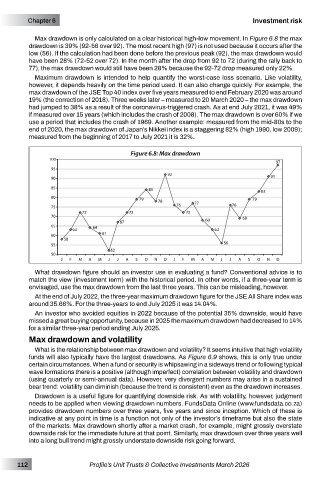
Max drawdown is only calculated on a clear historical high-low movement. In Figure 6.8 the max
drawdown is 39% (92-56 over 92). The most recent high (97) is not used because it occurs after the
low (56). If the calculation had been done before the previous peak (92), the max drawdown would
have been 28% (72-52 over 72). In the month after the drop from 92 to 72 (during the rally back to
77), the max drawdown would still have been 28% because the 92-72 drop measured only 22%.
Maximum drawdown is intended to help quantify the worst-case loss scenario. Like volatility,
however, it depends heavily on the time period used. It can also change quickly. For example, the
max drawdown of the JSE Top 40 index over five years measured to end February 2020 was around
19% (the correction of 2018). Three weeks later – measured to 20 March 2020 – the max drawdown
had jumped to 38% as a result of the coronavirus-triggered crash. As at end July 2021, it was 49%
if measured over 15 years (which includes the crash of 2008). The max drawdown is over 60% if we
use a period that includes the crash of 1969. Another example: measured from the mid-80s to the
end of 2020, the max drawdown of Japan’s Nikkei index is a staggering 82% (high 1990, low 2009);
measured from the beginning of 2017 to July 2021 it is 32%.
Figure 6.8: Max drawdown
What drawdown figure should an investor use in evaluating a fund? Conventional advice is to
match the view (investment term) with the historical period. In other words, if a three-year term is
envisaged, use the max drawdown from the last three years. This can be misleading, however.
At the end of July 2022, the three-year maximum drawdown figure for the JSE All Share index was
around 35.66%. For the three-years to end July 2025 it was 14.04%.
An investor who avoided equities in 2022 because of the potential 35% downside, would have
missed a great buying opportunity, because in 2025 the maximum drawdown had decreased to 14%
for a similar three-year period ending July 2025.
Max drawdown and volatility
What is the relationship between max drawdown and volatility? It seems intuitive that high volatility
funds will also typically have the largest drawdowns. As Figure 6.9 shows, this is only true under
certain circumstances. When a fund or security is whipsawing in a sideways trend or following typical
wave formations there is a positive (although imperfect) correlation between volatility and drawdown
(using quarterly or semi-annual data). However, very divergent numbers may arise in a sustained
bear trend: volatility can diminish (because the trend is consistent) even as the drawdown increases.
Drawdown is a useful figure for quantifying downside risk. As with volatility, however, judgment
needs to be applied when viewing drawdown numbers. FundsData Online (www.fundsdata.co.za)
provides drawdown numbers over three years, five years and since inception. Which of these is
indicative at any point in time is a function not only of the investor’s timeframe but also the state
of the markets. Max drawdown shortly after a market crash, for example, might grossly overstate
downside risk for the immediate future at that point. Similarly, max drawdown over three years well
into a long bull trend might grossly understate downside risk going forward.
112 Profile’s Unit Trusts & Collective Investments March 2026