
Page 213 - Profile's Unit Trusts & Collective Investments - March 2025
P. 213
Statistics Domestic Unit Trusts Performance Figures
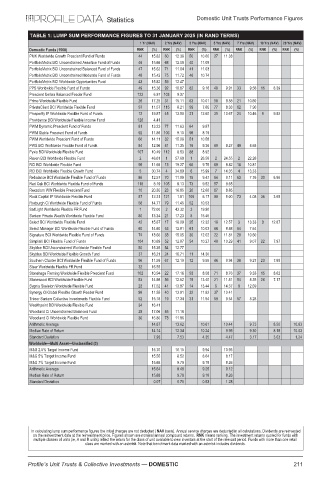
TABLE 1: LUMP SUM PERFORMANCE FIGURES TO 31 JANUARY 2025 (IN RAND TERMS)
1 Yr (NAV) 2 Yrs (NAV) 3 Yrs (NAV) 5 Yrs (NAV) 7 Yrs (NAV) 10 Yrs (NAV) 20 Yrs (NAV)
Domestic Funds (1568) RNK (%) RNK (%) RNK (%) RNK (%) RNK (%) RNK (%) RNK (%)
PMK Worldwide Growth Prescient Fund of Funds 44 15.82 60 12.38 50 10.60 27 11.33
PortfolioMetrix BCI Unconstrained Assertive Fund of Funds 46 15.66 68 12.09 40 11.08
PortfolioMetrix BCI Unconstrained Balanced Fund of Funds 47 15.62 71 11.94 41 11.03
PortfolioMetrix BCI Unconstrained Moderate Fund of Funds 48 15.42 75 11.72 46 10.74
PortfolioMetrix BCI Worldwide Opportunities Fund 43 15.82 59 12.47
PPS Worldwide Flexible Fund of Funds 49 15.36 92 10.87 82 9.16 48 9.91 33 9.56 16 8.39
Prescient Umbra Balanced Feeder Fund 122 6.87 103 9.37
Prime Worldwide Flexible Fund 26 17.25 31 15.11 63 10.01 58 9.58 21 10.60
PrivateClient BCI Worldwide Flexible Fund 97 11.57 115 8.21 99 7.85 77 8.33 62 7.90
Prosperity IP Worldwide Flexible Fund of Funds 12 19.87 45 13.50 21 12.60 35 10.67 24 10.46 9 9.92
Providence BCI Worldwide Flexible Income Fund 126 4.41
PWM Dynamic Prescient Fund of Funds 81 13.23 77 11.63 64 9.87
PWM Stable Prescient Fund of Funds 92 11.86 106 9.10 98 8.19
PWM Worldwide Prescient Fund of Funds 66 14.11 32 15.08 51 10.58
PWS BCI Worldwide Flexible Fund of Funds 84 12.96 81 11.35 76 9.36 60 9.27 49 8.68
Pyxis BCI Worldwide Flexible Fund 107 10.49 112 8.53 88 8.92
Raven BCI Worldwide Flexible Fund 2 46.01 1 57.69 1 26.58 2 24.55 2 22.26
RCI BCI Worldwide Flexible Fund 95 11.68 13 19.27 66 9.75 69 8.82 18 10.81
RCI BCI Worldwide Flexible Growth Fund 5 30.74 4 34.89 6 15.99 7 14.35 4 13.33
Rebalance BCI Worldwide Flexible Fund of Funds 86 12.57 70 11.98 75 9.47 64 9.11 63 7.76 30 6.96
Red Oak BCI Worldwide Flexible Fund of Funds 118 8.19 105 9.13 73 9.52 57 9.65
Rexsolom WW Flexible Prescient Fund 10 20.35 23 16.85 20 12.66 67 8.85
Rock Capital IP Worldwide Flexible Fund 87 12.31 121 1.81 106 6.17 90 5.00 73 4.08 36 3.65
Roxburgh Ci Worldwide Flexible Fund of Funds 56 14.77 79 11.45 52 10.53
SaltLight Worldwide Flexible FR Fund 1 72.00 2 43.32 3 19.90
Sanlam Private Wealth Worldwide Flexible Fund 80 13.34 21 17.23 8 15.45
Select BCI Worldwide Flexible Fund 42 15.87 17 18.09 25 12.32 18 12.57 3 13.33 3 12.87
Select Manager BCI Worldwide Flexible Fund of Funds 60 14.60 53 12.81 61 10.03 66 8.88 64 7.64
Signature BCI Worldwide Flexible Fund of Funds 74 13.66 33 15.05 30 12.02 22 11.81 20 10.60
Simplisiti BCI Flexible Fund of Funds 104 10.69 52 12.87 54 10.27 40 10.29 41 9.07 22 7.97
Skyblue BCI Unconstrained Worldwide Flexible Fund 50 15.35 54 12.77
Skyblue BCI Worldwide Flexible Growth Fund 37 16.21 24 16.71 11 14.30
Southern Charter BCI Worldwide Flexible Fund of Funds 96 11.59 67 12.10 72 9.55 46 9.94 38 9.27 23 7.89
Steer Worldwide Flexible FR Fund 32 16.55
Stonehage Fleming Worldwide Flexible Prescient Fund 102 10.94 22 17.16 93 8.58 71 8.76 37 9.33 15 8.62
Stonewood BCI Worldwide Flexible Fund 53 14.98 56 12.62 15 13.40 21 11.81 54 8.35 28 7.17
Sygnia Skeleton Worldwide Flexible Fund 23 17.52 41 13.87 14 13.44 6 14.37 8 12.69
Synergy Ci Global Flexible Growth Feeder Fund 98 11.55 40 13.91 32 11.82 37 10.41
Trésor Sanlam Collective Investments Flexible Fund 52 15.18 19 17.34 31 11.94 59 9.54 57 8.28
Wealthpoint BCI Worldwide Flexible Fund 34 16.41
Woodland Ci Unconstrained Balanced Fund 29 17.06 85 11.16
Woodland Ci Worldwide Flexible Fund 30 16.86 73 11.86
Arithmetic Average 14.87 13.62 10.61 10.44 9.73 8.50 10.63
Median Rate of Return 14.14 12.34 10.24 9.93 9.30 8.18 10.03
Standard Deviation 7.93 7.53 4.35 4.47 3.17 3.03 1.24
Worldwide—Multi Asset—Unclassified (3)
M&G 2.5% Target Income Fund 15.70 10.15 9.94 10.93
M&G 5% Target Income Fund 15.55 8.52 8.64 8.17
M&G 7% Target Income Fund 15.68 9.78 9.18 8.26
Arithmetic Average 15.64 9.48 9.25 9.12
Median Rate of Return 15.68 9.78 9.18 8.26
Standard Deviation 0.07 0.70 0.53 1.28
In calculating lump sum performance figures the initial charges are not deducted (NAV basis). Annual service charges are deducted in all calculations. Dividends are reinvested
on the reinvestment date at the reinvestment price. Figures shown are nominal annual compound returns. RNK means ranking. The investment returns quoted for funds with
multiple classes of units (ie, A and R units) reflect the return for the class of unit available to new investors at the start of the relevant period. Funds with more than one retail
class are marked with an asterisk. Note that benchmark data marked with an asterisk includes dividends.
Profile’s Unit Trusts & Collective Investments — DOMESTIC 211