
Page 248 - Profiles's Unit Trusts & Collective Investments - September 2024
P. 248
Alusi RealFin Managed Fund
Alusi RealFin Managed Fund
Alusi RealFin Managed Fund
Sector: South African—Multi Asset—
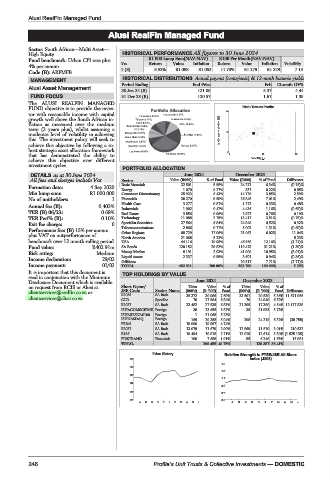
High Equity HISTORICAL PERFORMANCE All figures to 30 June 2024
Fund benchmark: Urban CPI rate plus R1 000 Lump Sum(NAV-NAV) R100 Per Month(NAV-NAV)
4% per annum Yrs Return Value Inflation Return Value Inflation Volatility
Code (B): ARFMFB 1 (B) 9.82% R1 098 R1 052 11.70% R1 279 R1 229 7.13
MANAGEMENT HISTORICAL DISTRIBUTIONS Actual payout (cents/unit) & 12-mnth historic yields
Period Ending End Price Feb 12-mnth DY%
Alusi Asset Management
30 Jun 24 (B) 121.05 5.37 4.44
FUND FOCUS 31 Dec 23 (B) 120.57 1.67 1.39
The ALUSI REALFIN MANAGED
FUND objective is to provide the inves- Risk / Return Profile
tor with reasonable income with capital 25
growth well above the South African in-
flation as measured over the medium
term (3 years plus), whilst assuming a 1yr Compound return(%)
moderate level of volatility in achieving 12
this. The investment policy will seek to
achieve this objective by following a ro-
bust strategic asset allocation framework 0
that has demonstrated the ability to 0 10 20
achieve this objective over different Volatility p.a.
investment cycles.
PORTFOLIO ALLOCATION
DETAILS as at 30 June 2024 June 2024 December 2023
All fees and charges include Vat Sector Value (R000) % of Fund Value (R000) % of Fund Difference
Basic Materials 22 501 5.58% 24 271 6.34% (0.76)%
Formation date: 4 Sep 2020 Energy 1 070 0.27% 837 0.22% 0.05%
Min lump sum: R1 000 000 Consumer Discretionary 25 923 6.43% 14 729 3.85% 2.59%
No of unitholders: 1 Financials 38 270 9.50% 26 845 7.01% 2.49%
Annual fee (B): 0.403% Health Care 3 277 0.81% 1 272 0.33% 0.48%
TER (B) 06/23: 0.69% Industrials 1 902 0.47% 4 436 1.16% (0.69)%
0.19%
0.76%
Real Estate
2 927
0.96%
3 856
TER Perf% (B): 0.10% Technology 11 088 2.75% 13 417 3.51% (0.75)%
Exit fee charge: 0 Specialist Securities 27 564 6.84% 24 949 6.52% 0.32%
Telecommunications 2 866 0.71% 5 002 1.31% (0.60)%
Performance fee: (B) 15% per annum Other Regions 68 729 17.06% 23 062 6.02% 11.04%
plus VAT on outperformance of North America 21 068 5.23% 5.23%
benchmark over 12 month rolling period USA 44 116 10.95% 46 558 12.16% (1.21)%
Fund value: R402.91m SA Bonds 120 152 29.82% 119 473 31.21% (1.39)%
Risk rating: Medium Money Market 8 191 2.03% 41 900 10.95% (8.91)%
Liquid Assets 2 337 0.58% 3 601 0.94% (0.36)%
Income declaration: 29/02
Offshore 29 517 7.71% (7.71)%
Income payment: 01/03 TOTAL 402 911 100.00% 382 799 100.00% 5.25%
It is important that this document is TOP HOLDINGS BY VALUE
read in conjunction with the Minimum
Disclosure Document which is available June 2024 December 2023
on request from RCIS or Alusi at Short Name/ Units Value %of Units Value %of
clientservices@realfin.co.za or JSE Code Sector Name (000’s) (R ‘000) Fund (000’s) (R ‘000) Fund Difference
clientservices@alusi.co.za R2035 SA Bnds 35 372 30 965 7.69% 23 501 20 530 5.36% 11 871 055
GLD SpecSec 70 27 564 6.84% 70 24 949 6.52% -
R2037 SA Bnds 33 482 27 535 6.83% 21 305 17 380 4.54% 12 177 839
ISHACOMSCIEME Foreign 38 23 655 5.87% 38 21 953 5.73% -
ISHARESNAS100 Foreign 1 21 068 5.23%
ISHNASDAQ Foreign 169 20 288 5.04% 208 24 210 6.32% (38 758)
FRB41 SA Bnds 19 000 19 097 4.74%
R2032 SA Bnds 13 079 11 679 2.90% 12 869 11 510 3.01% 210 532
R186 SA Bnds 10 494 10 918 2.71% 12 019 12 614 3.30% (1 525 135)
FIRSTRAND Financials 100 7 688 1.91% 85 6 240 1.63% 15 081
TOTAL 200 455 49.75% 139 387 36.41%
Price History Relative Strength to FTSE/JSE All Share
130 index (J203)
1.5
124
1.3
118
1.1
112
0.9
106 0.7
100 0.5
A S O N D J F M A M J A S O N D J F M A M J
246 Profile’s Unit Trusts & Collective Investments — DOMESTIC