
Page 191 - Profile's Unit Trusts & Collective Investments - March 2025
P. 191
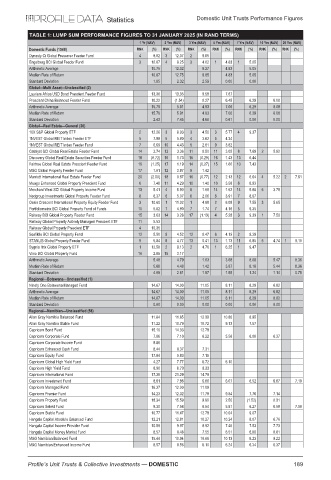
Statistics                Domestic Unit Trusts Performance Figures

         TABLE 1: LUMP SUM PERFORMANCE FIGURES TO 31 JANUARY 2025 (IN RAND TERMS)
                                         1 Yr (NAV)  2 Yrs (NAV)  3 Yrs (NAV)  5 Yrs (NAV)  7 Yrs (NAV)  10 Yrs (NAV)  20 Yrs (NAV)
         Domestic Funds (1568)          RNK  (%)  RNK  (%)  RNK  (%)  RNK  (%)  RNK  (%)  RNK  (%)  RNK  (%)
         Dynasty Ci Global Preserver Feeder Fund  4  8.02  3  12.07  2  9.85
         Engelberg BCI Global Feeder Fund  3  10.67  4  8.25  3  4.62  1  4.83  1  5.05
         Arithmetic Average                 10.75  12.02   8.27  4.83   5.05
         Median Rate of Return              10.87  12.75   9.85  4.83   5.05
         Standard Deviation                  1.85  2.32    2.59  0.00   0.00
         Global—Multi Asset—Unclassified (2)
         Laurium Africa USD Bond Prescient Feeder Fund  13.36  13.35  9.58  7.67
         Prescient China Balanced Feeder Fund  18.22  (1.54)  0.27  6.45  6.29  8.08
         Arithmetic Average                 15.79  5.91    4.93  7.06   6.29   8.08
         Median Rate of Return              15.79  5.91    4.93  7.06   6.29   8.08
         Standard Deviation                  2.43  7.45    4.66  0.61   0.00   0.00
         Global—Real Estate—General (20)
         10X S&P Global Property ETF     2  12.26  3  8.93  3  4.50  3  5.77  4  9.37
         1NVEST Global REIT Index Feeder ETF  5  7.99  5  5.80  4  3.62  5  4.34
         1NVEST Global REIT Index Feeder Fund  7  6.69  10  4.43  5  2.81  9  3.82
         Catalyst SCI Global Real Estate Feeder Fund  14  3.74  13  3.36  11  0.50  11  3.05  8  7.69  2  5.92
         Discovery Global Real Estate Securities Feeder Fund  18  (0.72)  16  1.73  15  (0.29)  16  1.43  13  6.44
         Fairtree Global Real Estate Prescient Feeder Fund  19  (1.25)  17  1.19  14  (0.27)  15  1.60  10  7.43
         M&G Global Property Feeder Fund  17  1.01  12  3.87  9  1.42
         Marriott International Real Estate Feeder Fund  20  (2.00)  18  0.87  16  (0.77)  12  2.13  12  6.64  4  5.22  2  7.61
         Meago Enhanced Global Property Prescient Fund  6  7.48  11  4.29  10  1.40  10  3.58  6  8.93
         Merchant West SCI Global Property Income Fund  13  5.41  4  5.90  8  1.69  14  1.62  14  5.88  6  3.79
         Nedgroup Investments Global Property Feeder Fund  8  6.37  6  5.07  6  2.06  8  3.91  7  8.67
         Oasis Crescent International Property Equity Feeder Fund  3  10.60  1  11.02  1  4.88  2  6.08  9  7.55  3  5.65
         Portfoliometrix BCI Global Property Fund of Funds  10  5.82  7  4.80  7  1.74  7  4.16  5  9.35
         Reitway BCI Global Property Feeder Fund  15  3.63  14  3.28  17  (1.19)  4  5.28  3  9.39  1  7.50
         Reitway Global Property Actively Managed Prescient ETF  11  5.53
         Reitway Global Property Prescient ETF  4  10.35
         Sesfikile BCI Global Property Fund  12  5.50  9  4.52  12  0.47  6  4.19  2  9.39
         STANLIB Global Property Feeder Fund  9  5.84  8  4.77  13  0.41  13  1.73  11  6.85  5  4.74  1  9.10
         Sygnia Itrix Global Property ETF  1  12.58  2  9.13  2  4.76  1  6.25  1  9.47
         Visio BCI Global Property Fund  16  2.85  15  3.17
         Arithmetic Average                  5.48  4.79    1.63  3.68   8.08   5.47  8.36
         Median Rate of Return               5.68  4.48    1.42  3.87   8.18   5.44  8.36
         Standard Deviation                  4.08  2.61    1.87  1.59   1.24   1.14  0.75
         Regional—Botswana—Unclassified (1)
         Ninety One Botswana Managed Fund   14.67  14.00  11.05  8.11   8.29   6.82
         Arithmetic Average                 14.67  14.00  11.05  8.11   8.29   6.82
         Median Rate of Return              14.67  14.00  11.05  8.11   8.29   6.82
         Standard Deviation                  0.00  0.00    0.00  0.00   0.00   0.00
         Regional—Namibian—Unclassified (58)
         Allan Gray Namibia Balanced Fund   11.84  11.85  12.39  10.86  8.95
         Allan Gray Namibia Stable Fund     11.22  10.79  10.72  9.13   7.57
         Capricorn Bond Fund                15.10  14.33  12.78
         Capricorn Corporate Fund            7.86  7.10    6.22  5.56   6.00   6.37
         Capricorn Corporate Income Fund     8.86
         Capricorn Enhanced Cash Fund        8.44  8.37    7.31
         Capricorn Equity Fund              17.84  5.83    7.15
         Capricorn Global High Yield Fund    4.27  7.77    8.72  6.10
         Capricorn High Yield Fund           8.90  8.79    8.33
         Capricorn International Fund       17.39  21.29  14.79
         Capricorn Investment Fund           8.61  7.86    6.86  6.07   6.52   6.87  7.19
         Capricorn Managed Fund             16.37  12.00  11.09
         Capricorn Premier Fund             14.23  12.32  11.78  9.84   7.76   7.14
         Capricorn Property Fund            18.34  15.59   9.90  2.50  (1.52)  0.31
         Capricorn Selekt Fund               8.30  7.56    6.54  5.81   6.27   6.58  7.00
         Capricorn Stable Fund              10.77  11.47  12.78  10.04  9.07
         Hangala Capital Absolute Balanced Fund  12.21  12.81  10.27  10.24  8.07  6.76
         Hangala Capital Income Provider Fund  10.59  9.97  8.92  7.46  7.53   7.73
         Hangala Capital Money Market Fund   8.57  8.48    7.55  6.51   6.80   6.81
         M&G Namibian Balanced Fund         15.44  10.94  10.66  10.13  8.23   8.22
         M&G Namibian Enhanced Income Fund   8.57  8.56    8.10  6.24   6.34   6.37


         Profile’s Unit Trusts & Collective Investments — DOMESTIC                   189