
Page 271 - Profile's Unit Trusts & Collective Investments - March 2026
P. 271
Domestic Camissa SA Equity Fund
Camissa SA Equity Fund
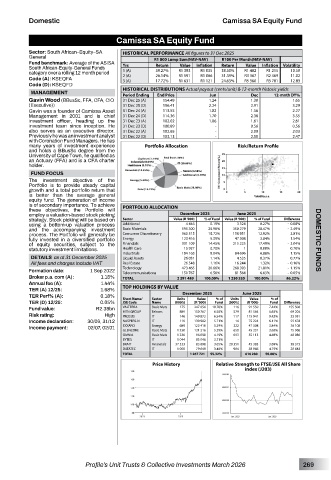
Sector: South African–Equity–SA HISTORICAL PERFORMANCE All figures to 31 Dec 2025
General R1 000 Lump Sum(NAV-NAV) R100 Per Month(NAV-NAV)
Fund benchmark: Average of the ASISA
South African-Equity-General Funds Yrs Return Value Inflation Return Value Inflation Volatility
category over a rolling 12 month period 1 (A) 39.27% R1 393 R1 035 38.50% R1 482 R1 215 10.50
R1 591
26.14%
2 (A)
R1 066
R2 469
11.02
31.39%
R3 367
Code (A): KSEQFA 3 (A) 17.72% R1 631 R1 121 24.63% R5 360 R3 781 12.83
Code (D): KSEQFD
HISTORICAL DISTRIBUTIONS Actual payout (cents/unit) & 12-month historic yields
MANAGEMENT Period Ending End Price Jun Dec 12-mnth DY%
Gavin Wood (BBusSc, FFA, CFA, CIO 31 Dec 25 (A) 154.49 1.24 1.30 1.65
(Executive)) 31 Dec 25 (D) 156.41 2.24 2.91 3.29
Gavin was a founder of Camissa Asset 31 Dec 24 (A) 113.55 1.02 1.56 2.27
Management in 2001 and is chief 31 Dec 24 (D) 114.36 1.70 2.36 3.55
investment officer, heading up the 31 Dec 23 (A) 102.02 1.06 1.61 2.61
investment team since inception. He 31 Dec 23 (D) 100.89 - 0.56 0.56
also serves as an executive director. 31 Dec 22 (A) 102.65 - 2.09 2.03
Previously he was an investment analyst 31 Dec 22 (D) 103.13 - 2.55 2.47
with Coronation Fund Managers. He has
many years of investment experience Portfolio Allocation Risk/Return Profile
and holds a BBusSc degree from the
University of Cape Town, he qualified as
an Actuary (FFA) and is a CFA charter
holder.
FUND FOCUS 3Yr Compound Return(%)
The investment objective of the
Portfolio is to provide steady capital
growth and a total portfolio return that
is better than the average general
equity fund. The generation of income
is of secondary importance. To achieve
these objectives, the Portfolio will PORTFOLIO ALLOCATION
employ a valuation-based stock picking December 2025 June 2025
strategy. Stock picking will be based on Sector Value (R ‘000) % of Fund Value (R ‘000) % of Fund Difference
using a bottom-up valuation process Additional 4 446 0.19% 3 324 0.27% - 0.08%
and the accompanying investment Basic Materials 595 300 25.98% 350 279 28.47% - 2.49%
process. The Portfolio will generally be Consumer Discretionary 360 315 15.72% 158 951 12.92% 2.81%
fully invested in a diversified portfolio Energy 123 416 5.39% 47 308 3.84% 1.54% DOMESTIC FUNDS
of equity securities, subject to the Financials 331 109 14.45% 215 225 17.49% - 3.04%
statutory investment limitations. Health Care 15 927 0.70% 1 0.00% 0.70%
DETAILS as at 31 December 2025 Industrials 184 163 8.04% 84 696 6.88% 1.15%
1.14%
4 535
0.77%
0.37%
26 031
Liquid Assets
All fees and charges include VAT Real Estate 26 548 1.16% 16 244 1.32% - 0.16%
Formation date: 1 Sep 2022 Technology 473 465 20.66% 268 393 21.81% - 1.15%
81 564
6.63%
6.58%
Telecommunications
150 767
- 0.05%
Broker p.a. com (A): 1.15% TOTAL 2 291 489 100.00% 1 230 520 100.00% 86.22%
Annual fee (A): 1.44%
TER (A) 12/25: 1.68% TOP HOLDINGS BY VALUE
TER Perf% (A): 0.18% Short Name/ Sector Units December 2025 % of Units June 2025 % of
Value
Value
TER (D) 12/25: 0.05% JSE Code Name (000’s) (R ‘000) Fund (000’s) (R ‘000) Fund Difference
Fund value: R2.38bn VALTERRA Basic Mats 175 247 056 10.78% 116 91 550 7.44% 155 506
81 564
Risk rating: High MTN GROUP Telcom 889 150 767 6.58% 579 115 941 6.63% 69 204
6.54%
117
149 872
33 931
PROSUS
9.42%
146
IT
Income declaration: 30/06, 31/12 NASPERS-N IT 119 130 902 5.71% 14 75 224 6.11% 55 678
Income payment: 02/07, 02/01 EXXARO Energy 689 123 416 5.39% 322 47 308 3.84% 76 108
GLENCORE Basic Mats 1 330 121 216 5.29% 650 45 231 3.68% 75 986
OMNIA Basic Mats 1 220 96 098 4.19% 693 55 113 4.48% 40 986
BYTES IT 1 044 85 046 3.71% - - - -
BRAIT Financials 37 533 83 698 3.65% 20 351 45 383 3.69% 38 315
DATATEC IT 1 008 79 649 3.48% 904 58 966 4.79% 20 683
TOTAL 1 267 721 55.32% 616 280 50.08%
Price History Relative Strength to FTSE/JSE All Share
index (J203)
Profile’s Unit Trusts & Collective Investments March 2026 269