
Page 269 - Profile's Unit Trusts & Collective Investments - March 2026
P. 269
Domestic Camissa Protector Fund
Camissa Protector Fund
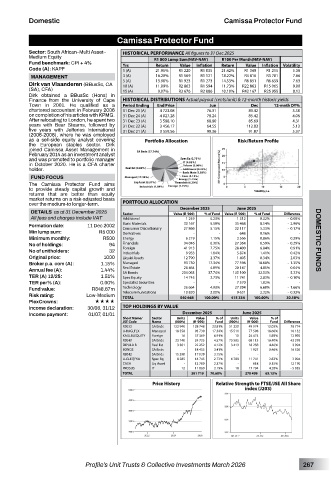
Sector: South African–Multi Asset– HISTORICAL PERFORMANCE All figures to 31 Dec 2025
Medium Equity R1 000 Lump Sum(NAV-NAV) R100 Per Month(NAV-NAV)
Fund benchmark: CPI + 4% Yrs Return Value Inflation Return Value Inflation Volatility
Code (A): KAPF 1 (A) 21.95% R1 220 R1 035 21.42% R1 349 R1 215 5.38
MANAGEMENT 3 (A) 16.20% R1 569 R1 121 18.22% R4 816 R3 781 7.66
R8 851
R6 659
Dirk van Vlaanderen (BBusSc, CA 5 (A) 13.98% R1 923 R1 273 14.53% R22 863 R15 065 7.63
R1 594
9.00
11.09%
R2 863
10 (A)
11.73%
(SA), CFA) 15 (A) 9.07% R3 676 R2 086 10.10% R42 167 R25 955 8.12
Dirk obtained a BBusSc (Hons) in
Finance from the University of Cape HISTORICAL DISTRIBUTIONS Actual payout (cents/unit) & 12-month historic yields
Town in 2001. He qualified as a Period Ending End Price Jun Dec 12-mnth DY%
chartered accountant in February 2006 31 Dec 25 (A) 4 723.08 76.31 83.42 3.38
on completion of his articles with KPMG. 31 Dec 24 (A) 4 027.28 78.24 85.42 4.06
After relocating to London, he spent two 31 Dec 23 (A) 3 588.10 68.80 85.69 4.31
years with Bear Stearns, followed by 31 Dec 22 (A) 3 456.17 64.55 112.83 5.13
five years with Jefferies International 31 Dec 21 (A) 3 559.56 99.36 91.87 5.37
(2006-2008), where he was employed
as a sell-side equity analyst covering Portfolio Allocation Risk/Return Profile
the European staples sector. Dirk
joined Camissa Asset Management in
February 2014 as an investment analyst
and was promoted to portfolio manager
in October 2020. He is a CFA charter
holder. 3Yr Compound Return(%)
FUND FOCUS
The Camissa Protector Fund aims
to provide steady capital growth and
returns that are better than equity
market returns on a risk-adjusted basis
over the medium-to longer-term. PORTFOLIO ALLOCATION
December 2025 June 2025
DETAILS as at 31 December 2025 Sector Value (R ‘000) % of Fund Value (R ‘000) % of Fund Difference
All fees and charges include VAT Additional 1 249 0.23% 1 312 0.32% - 0.09%
Formation date: 11 Dec 2002 Basic Materials 30 167 5.58% 35 468 8.54% - 2.96%
- 0.17%
5.15%
27 866
5.33%
22 117
Consumer Discretionary
Min lump sum: R5 000 Derivatives - - 648 0.16% -
Minimum monthly: R500 Energy 6 219 1.15% 3 566 0.86% 0.29% DOMESTIC FUNDS
No of holdings: 94 Financials 34 046 6.30% 27 364 6.59% - 0.29%
No of unitholders: 32 Foreign 41 913 7.75% 28 400 6.84% 0.91%
1.41%
1.84%
5 874
0.42%
Industrials
9 933
Original price: 1000 Liquid Assets 12 790 2.37% 1 405 0.34% 2.03%
Broker p.a. com (A): 1.15% Managed 93 730 17.34% 77 598 18.68% - 1.35%
4.89%
20 147
26 464
4.85%
Annual fee (A): 1.44% Real Estate 204 063 37.74% 135 100 32.53% 0.04%
SA Bonds
5.22%
TER (A) 12/25: 1.51% Spec Equity 14 745 2.73% 11 741 2.83% - 0.10%
TER per% (A): 0.00% Specialist Securities - - 7 570 1.82% -
Fund value: R548.67m Technology 26 664 4.93% 27 394 6.60% - 1.66%
10 820
2.32%
9 631
- 0.32%
2.00%
Risk rating: Low-Medium Telecommunications 540 668 100.00% 415 334 100.00% 30.18%
TOTAL
PlexCrowns: ««««
Income declaration: 30/06, 31/12 TOP HOLDINGS BY VALUE
Income payment: 01/07, 01/01 December 2025 June 2025
Short Name/ Sector Units Value % of Units Value % of
JSE Code Name (000’s) (R ‘000) Fund (000’s) (R ‘000) Fund Difference
R2032 SA Bnds 122 940 128 748 23.81% 51 220 49 974 12.03% 78 774
U-KAGLFLX Managed 18 558 93 730 17.34% 15 511 77 598 18.68% 16 132
KAGLBLEQUITY Foreign 16 37 369 6.91% 10 24 474 5.89% 12 895
R2040 SA Bnds 23 740 24 735 4.57% 75 505 68 113 16.40% - 43 378
DIPULA B Real Est 3 301 22 252 4.12% 3 413 18 258 4.40% 3 994
BONDS SA Bnds - 18 453 3.41% - 1 927 0.46% 16 526
R2042 SA Bnds 15 290 17 039 3.15% - - - -
U-GLEQFKA Spec Eq 8 285 14 745 2.73% 6 789 11 741 2.83% 3 004
CASH Liq Asset - 12 789 2.37% - 618 0.15% 12 170
PROSUS IT 12 11 860 2.19% 18 17 794 4.28% - 5 935
TOTAL 381 719 70.60% 270 498 65.13%
Price History Relative Strength to FTSE/JSE All Share
index (J203)
Profile’s Unit Trusts & Collective Investments March 2026 267