
Page 263 - Profile's Unit Trusts & Collective Investments - March 2026
P. 263
Domestic Camissa Equity Alpha Fund
Camissa Equity Alpha Fund
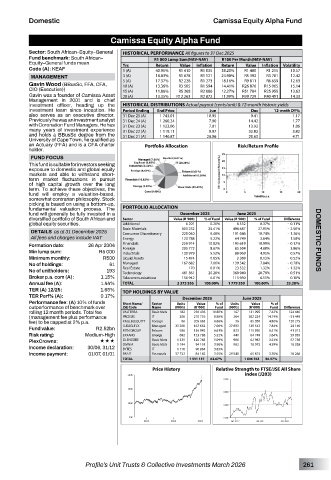
Sector: South African–Equity–General HISTORICAL PERFORMANCE All figures to 31 Dec 2025
Fund benchmark: South African– R1 000 Lump Sum(NAV-NAV) R100 Per Month(NAV-NAV)
Equity–General funds mean Yrs Return Value Inflation Return Value Inflation Volatility
Code (A): KEAF 1 (A) 40.95% R1 410 R1 035 38.20% R1 480 R1 215 10.57
MANAGEMENT 3 (A) 18.83% R1 678 R1 121 24.98% R5 392 R3 781 12.42
R9 811
R6 659
Gavin Wood (BBusSc, FFA, CFA, 5 (A) 17.37% R2 228 R1 273 18.16% R26 876 R15 065 12.63
10 (A)
13.36%
R3 505
14.41%
R1 594
15.14
CIO (Executive)) 15 (A) 11.86% R5 368 R2 086 12.27% R51 784 R25 955 13.63
Gavin was a founder of Camissa Asset 20 (A) 13.35% R12 263 R2 872 11.99% R99 729 R40 491 14.33
Management in 2001 and is chief
investment officer, heading up the HISTORICAL DISTRIBUTIONS Actual payout (cents/unit) & 12-month historic yields
investment team since inception. He Period Ending End Price Jun Dec 12-mnth DY%
also serves as an executive director. 31 Dec 25 (A) 1 743.01 10.95 9.41 1.17
Previously he was an investment analyst 31 Dec 24 (A) 1 260.24 7.90 14.42 1.77
with Coronation Fund Managers. He has 31 Dec 23 (A) 1 123.06 7.01 13.92 1.86
many years of investment experience 31 Dec 22 (A) 1 119.11 9.97 32.82 3.82
and holds a BBusSc degree from the 31 Dec 21 (A) 1 140.87 28.06 25.63 4.71
University of Cape Town, he qualified as
an Actuary (FFA) and is a CFA charter Portfolio Allocation Risk/Return Profile
holder.
FUND FOCUS
This fund is suitable for investors seeking
exposure to domestic and global equity
markets and able to withstand short- 3Yr Compound Return(%)
term market fluctuations in pursuit
of high capital growth over the long
term. To achieve these objectives, the
fund will employ a valuation-based,
somewhat contrarian philosophy. Stock
picking is based on using a bottom-up,
fundamental valuation process. The PORTFOLIO ALLOCATION
fund will generally be fully invested in a December 2025 June 2025
diversified portfolio of South African and Sector Value (R ‘000) % of Fund Value (R ‘000) % of Fund Difference
global equity securities. Additional 6 201 0.26% 6 532 0.37% - 0.11%
DETAILS as at 31 December 2025 Basic Materials 603 232 25.41% 496 687 27.91% - 2.50%
191 086
9.48%
10.74%
Consumer Discretionary
- 1.26%
225 040
All fees and charges include VAT Energy 123 788 5.22% 64 749 3.64% 1.58% DOMESTIC FUNDS
Formation date: 26 Apr 2004 Financials 256 914 10.82% 195 619 10.99% - 0.17%
Min lump sum: R5 000 Foreign 205 772 8.67% 85 504 4.80% 3.86%
130 979
88 069
4.95%
Industrials
0.57%
5.52%
Minimum monthly: R500 Liquid Assets 15 474 0.65% 2 369 0.13% 0.52%
No of holdings: 61 Managed 167 682 7.06% 139 542 7.84% - 0.78%
23 532
0.01%
170
1.32%
No of unitholders: 193 Real Estate 481 361 20.28% 369 940 20.79% - 1.32%
- 0.51%
Technology
Broker p.a. com (A): 1.15% Telecommunications 156 942 6.61% 115 930 6.51% 0.10%
Annual fee (A): 1.44% TOTAL 2 373 556 100.00% 1 779 559 100.00% 33.38%
TER (A) 12/25: 1.65% TOP HOLDINGS BY VALUE
TER Perf% (A): 0.17% December 2025 June 2025
Performance fee: (A) 10% of funds Short Name/ Sector Units Value % of Units Value % of
outperformance of benchmark over JSE Code Name (000’s) (R ‘000) Fund (000’s) (R ‘000) Fund Difference
rolling 12 month periods. Total fee VALTERRA Basic Mats 182 256 436 10.80% 167 131 995 7.42% 124 440
(management fee plus performance PROSUS IT 206 210 776 8.88% 264 262 224 14.74% - 51 449
fee) to be capped at 2% p.a. KAGLBLEQUITY Foreign 86 205 663 8.66% 36 85 389 4.80% 120 275
Fund value: R2.52bn U-KAGLFLX Managed 33 200 167 682 7.06% 27 893 139 542 7.84% 28 140
41 012
823
6.51%
6.61%
115 930
926
Telcom
MTN GROUP
156 942
Risk rating: Medium-High EXXARO Energy 692 123 788 5.22% 441 64 749 3.64% 59 039
PlexCrowns: ««« GLENCORE Basic Mats 1 325 120 743 5.09% 906 62 987 3.54% 57 756
Income declaration: 30/06, 31/12 OMNIA Basic Mats 1 194 94 101 3.96% 982 - 78 073 - 4.39% - 16 028 -
IT
BYTES
3.83%
1 116
90 884
Income payment: 01/07, 01/01 BRAIT Financials 37 732 84 142 3.55% 29 540 65 874 3.70% 18 268
TOTAL 1 511 157 63.67% 1 006 763 56.57%
Price History Relative Strength to FTSE/JSE All Share
index (J203)
Profile’s Unit Trusts & Collective Investments March 2026 261