Page 262 - Profile's Unit Trusts & Collective Investments - March 2026
P. 262

Camissa Balanced Fund                                                Domestic

                                  Camissa Balanced Fund

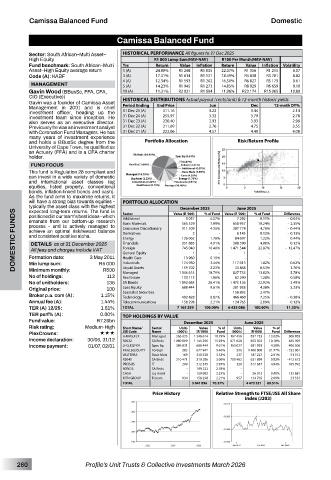
         Sector: South African–Multi Asset–  HISTORICAL PERFORMANCE All figures to 31 Dec 2025
         High Equity                         R1 000 Lump Sum(NAV-NAV)  R100 Per Month(NAV-NAV)
         Fund benchmark: South African–Multi   Yrs  Return  Value  Inflation  Return  Value  Inflation  Volatility
         Asset–High Equity average return  1 (A)  24.80%  R1 248  R1 035  22.37%  R1 356  R1 215   6.07
         Code (A): KABF             3 (A)    17.31%  R1 614  R1 121  18.49%  R4 838  R3 781   8.82
                                    4 (A)    12.34%  R1 593  R1 202  16.50%  R6 827  R5 173   9.61
          MANAGEMENT                5 (A)    14.23%  R1 945  R1 273  14.85%  R8 929  R6 659   9.10
         Gavin Wood (BBusSc, FFA, CFA,   10 (A)  11.31%  R2 921  R1 594  11.96%  R23 174  R15 065   10.80
         CIO (Executive))           HISTORICAL DISTRIBUTIONS Actual payout (cents/unit) & 12-month historic yields
         Gavin was a founder of Camissa Asset
         Management  in  2001  and  is  chief   Period Ending  End Price  Jun  Dec  12-mnth DY%
         investment  officer,  heading  up  the   31 Dec 25 (A)    311.16  3.22  3.44  2.14
         investment  team  since  inception.  He   31 Dec 24 (A)    255.97  3.32  3.79  2.78
         also  serves  as  an  executive  director.   31 Dec 23 (A)    230.40  2.93  3.93  2.98
         Previously he was an investment analyst   31 Dec 22 (A)    211.69  2.76  4.75  3.55
         with Coronation Fund Managers. He has   31 Dec 21 (A)    222.06  4.57  4.49  4.08
         many  years  of  investment  experience
         and  holds  a  BBusSc  degree  from  the   Portfolio Allocation  Risk/Return Profile
         University of Cape Town, he qualified as
         an Actuary (FFA) and is a CFA charter
         holder.

          FUND FOCUS
         This fund is Regulation 28 compliant and                        3Yr Compound Return(%)

         can  invest  in  a  wide  variety  of  domestic

         and  international  asset  classes  (eg

         equities,  listed  property,  conventional
         bonds, inflation-linked bonds and cash).
         As the fund aims to maximise returns, it
         will have a strong bias towards equities -   PORTFOLIO ALLOCATION
         typically the asset class with the highest   Sector  Value (R ‘000)  % of Fund  Value (R ‘000)  % of Fund  Difference
                                                    December 2025
                                                                    June 2025
         expected  long-term  returns.  The  fund  is
     DOMESTIC FUNDS  process  -  and  is  actively  managed  to   Basic Materials  565 529 2 1  10.40% - -  1 471 544 1 -  10.24% - -  -  12.47% - -
         positioned in our team’s best ideas - which
                                    Additional
                                                             0.07%
                                                      5 057
                                                                           0.11%
                                                                                   -  0.04%
                                                                    7 292
         emanate  from  our  bottom-up  research
                                                                                   -  2.35%
                                                             7.89%
                                                                   658 957
                                                     311 509
                                                             4.35%
                                    Consumer Discretionary
                                                                                   -  0.44%
                                                                           4.78%
                                                                   307 774
         achieve  an  optimal  risk/reward  balance
                                    Derivatives
                                                                                   -  0.13%
                                                                    8 145
                                                                           0.13%
         and consistent positive alpha.
                                                                    84 697
                                                             1.76%
                                                                           1.32%
                                                     126 062
                                                                                    0.44%
                                    Energy
                                    Financials
                                                                                    0.12%
                                                     351 885
          DETAILS  as at 31 December 2025
                                                                           4.80%
                                                             4.91%
                                                                   308 590
                                                     745 040
                                                                          22.87%
                                    Foreign
          All fees and charges include VAT
                                    General Equity
                           3 May 2011
         Formation date:
                                                             0.19%
                                    Health Care
                                                     13 960
         Min lump sum:
                                                                           1.82%
                                                     174 930
                                                             2.44%
                                                                           0.53%
                                                             2.23%
                                                     159 702
                                                                    33 868
                                                                                    1.70%
                                    Liquid Assets
                              R500
         Minimum monthly:
                                    Managed
                                                                   837 733
                                                                                    5.78%
         No of holdings:     R5 000  Industrials    1 346 614  18.79%  117 013  13.02%  0.62%
                               113
                                                             1.86%
                                                     133 113
                                    Real Estate
                                                                           1.28%
                                                                    82 290
                                                                                    0.58%
         No of unitholders:    135  SA Bonds        1 892 685  26.41%  1 475 126  22.92%  3.49%
         Original price:       100  Spec Equity      688 444  9.61%  281 938  4.38%  5.23%
         Broker p.a. com (A):  1.15%  Specialist Securities  492 428 -  6.87% -  158 892  2.47%  -  0.38% -
                                                                           7.25%
                                                                   466 460
                                    Technology
         Annual fee (A):      1.44%  Telecommunications  158 298  2.21%  134 765  2.09%  0.12%
         TER (A) 12/25:       1.51%  TOTAL         7 165 259  100.00%  6 435 086  100.00%  11.35%
         TER perf% (A):       0.00%  TOP HOLDINGS BY VALUE
         Fund value:        R7.26bn                  December 2025     June 2025
         Risk rating:    Medium-High  Short Name/    Sector   Units   Value   % of   Units   Value   % of
                                                         (R ‘000)
                                                   (000’s)
                                                                              Fund
                                                               Fund
                                                                   (000’s)
         PlexCrowns:         «««    JSE Code  Name  266 625  1 346 614  18.79%  167 456  (R ‘000)  13.02%  Difference
                                    U-KAGLFLX
                                                                                   508 882
                                                                        837 733
                                            Managed
         Income declaration:  30/06, 31/12  R2032  SA Bnds  1 089 809  1 141 296  15.93%  671 628  655 302  10.18%  485 995
         Income payment:  01/07, 02/01  U-GLEQFKA  Spec Eq  386 831  688 444  9.61%  163 027  281 938  4.38%  406 506
                                    KAGLBLEQUITY  Foreign  283  677 947  9.46%  596  1 400 808  21.77%  - 722 861
                                    VALTERRA  Basic Mats  169  238 538  3.33%  237  187 227  2.91%  51 312
                                    R2040   SA Bnds  210 471  219 286  3.06%  700 482  631 899  9.82%  - 412 612
                                    PROSUS  IT       208  212 545  2.97%  320  317 637  4.94%  - 105 092
                                    BONDS   SA Bnds   -  199 233  2.78%  -  -   -     -
                                    CASH    Liq Asset  -  159 692  2.23%  -  26 012  0.40%  133 681
                                    MTN GROUP  Telcom  934  158 298  2.21%  957  134 765  2.09%  23 533
                                    TOTAL               5 041 896  70.37%  4 473 321  69.51%
                                            Price History     Relative Strength to FTSE/JSE All Share
                                                                       index (J203)


      260                Profile’s Unit Trusts & Collective Investments March 2026
   257   258   259   260   261   262   263   264   265   266   267