Page 256 - Profile's Unit Trusts & Collective Investments - March 2026
P. 256

Alusi RealFin Managed Fund                                           Domestic

                                Alusi RealFin Managed Fund
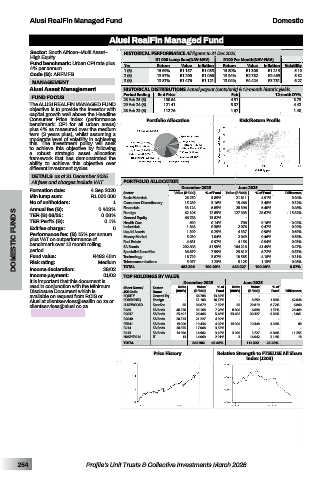
         Sector: South African–Multi Asset–  HISTORICAL PERFORMANCE All figures to 31 Dec 2025
         High Equity                         R1 000 Lump Sum(NAV-NAV)  R100 Per Month(NAV-NAV)
         Fund benchmark: Urban CPI rate plus
                                                                       Value
                                                    Value
         4% per annum               Yrs      Return  R1 157  Inflation  Return  R1 308  Inflation  Volatility
                                                                             R1 215
                                                          R1 035
                                                                15.80%
                                    1 (B)
                                             15.69%
                                                                                     5.10
         Code (B): ARFMFB           2 (B)    13.57%  R1 290  R1 066  13.94%  R2 782  R2 469   5.32
          MANAGEMENT                3 (B)    13.87%  R1 476  R1 121  13.04%  R4 424  R3 781   6.27
         Alusi Asset Management     HISTORICAL DISTRIBUTIONS Actual payout (cents/unit) & 12-month historic yields
                                    Period Ending  End Price       Feb         12-mnth DY%
          FUND FOCUS                28 Feb 25 (B)    130.64       4.91              3.75
         The ALUSI REALFIN MANAGED FUND   29 Feb 24 (B)    121.41  5.37             4.42
         objective is to provide the investor with   28 Feb 23 (B)    112.76  1.67  1.48
         capital growth well above the Headline
         Consumer  Price  Index  (performance   Portfolio Allocation  Risk/Return Profile
         benchmark:  CPI  for  all  urban  areas)
         plus 4% as measured over the medium
         term (3 years plus), whilst assuming a
         moderate level of volatility in achieving
         this.  The  investment  policy  will  seek

         to  achieve  this  objective  by  following                                          3Yr Compound Return(%)

         a  robust  strategic  asset  allocation
         framework  that  has  demonstrated  the
         ability  to  achieve  this  objective  over

         different investment cycles.
          DETAILS  as at 31 December 2025
          All fees and charges include VAT  PORTFOLIO ALLOCATION
         Formation date:   4 Sep 2020               December 2025   June 2025
         Min lump sum:     R1 000 000  Sector     Value (R ‘000)  % of Fund  Value (R ‘000)  % of Fund  Difference
                                                             5.85%
                                                                    21 811
                                                                                    0.94%
                                    Basic Materials
                                                     28 270
                                                                           4.91%
         No of unitholders:      1  Consumer Discretionary  15 289  3.16%  15 466  3.48%  -  0.32%
         Annual fee (B):     0.403%  Financials      33 124  12.85%  127 303 -  28.67% -  -  15.82% -
                                                                    28 396
                                                                                    0.46%
                                                                           6.40%
                                                             6.85%
     DOMESTIC FUNDS  Exit fee charge:  R483.40m 0  Industrials  202 808  41.95%  184 216  41.49%  -  0.09%
                                    Foreign
                                                     62 106
         TER (B) 06/25:
                              0.06%
                                    General Equity
                                                     66 788
                                                            13.82%
                              0.1%
         TER Perf% (B):
                                    Health Care
                                                       690
                                                                           0.16%
                                                                     706
                                                                                   -  0.02%
                                                             0.14%
                                                                    2 076
                                                                           0.47%
                                                             0.38%
                                                      1 848
                                                      1 399
                                                             0.29%
                                                                                   -  0.69%
                                                                    4 337
                                    Liquid Assets
         Performance fee: (B) 15% per annum
                                                                           0.98%
                                                      5 030
                                                                                    0.58%
                                    Money Market
                                                             1.04%
         plus VAT on outperformance of
                                                                    2 049
                                                                           0.46%
         benchmark over 12 month rolling
                                                      4 681
                                                                           0.94%
                                    Real Estate
                                                                                    0.03%
                                                             0.97%
                                                                    4 156
                                    SA Bonds
                                                                                    0.47%
         period
                                                             7.59%
                                                                                    0.87%
                                    Specialist Securities
                                                     36 679
                                                                    29 819
                                                                           6.72%
         Fund value:
                                                                    18 565
                                                             3.87%
                                                                                   -  0.31%
                                                                           4.18%
                                                     18 729
                                    Technology
         Risk rating:
                                                                    5 125
                                                                           1.15%
                                                             1.23%
                                                      5 957
                                                                                    0.08%
                                    TOTAL
                              28/02
         Income declaration:
         Income payment:     Medium  Telecommunications  483 398  100.00%  444 027  100.00%  8.87%
                              01/03
                                    TOP HOLDINGS BY VALUE
         It is important that this document is       December 2025    June 2025
         read in conjunction with the Minimum   Short Name/    Sector   Units   Value   % of   Units   Value   % of
         Disclosure Document which is   JSE Code  Name  (000’s)  (R ‘000)  Fund  (000’s)  (R ‘000)  Fund  Difference
         available on request from RCIS or   EQUITY  General Eq  -  66 788  13.82%  -  -  -  -
         Alusi at clientservices@realfin.co.za or   FOREIGNEQ  Foreign  -  51 108  10.57%  -  8 259  1.86%  42 848
         clientservices@alusi.co.za  U-NEWGOLD  SpecSec  55  36 679  7.59%  55  29 819  6.72%  6 860
                                    R209    SA Bnds  40 378  35 168  7.28%  8 800  6 698  1.51%  28 469
                                    R2037   SA Bnds  25 691  26 466  5.48%  33 482  30 327  6.83%  - 3 861
                                    R2040   SA Bnds  20 373  21 227  4.39%  -  -  -   -
                                    FRB41   SA Bnds  19 000  19 436  4.02%  19 000  19 348  4.36%  88
                                    R214    SA Bnds  20 875  17 068  3.53%  -  -  -   -
                                    R213    SA Bnds  14 956  14 982  3.10%  3 950  3 727  0.84%  11 255
                                    NASPERS-N  IT    13  14 060  2.91%  3  14 042  3.16%  18
                                    TOTAL              302 982  62.68%  112 222  25.28%
                                            Price History     Relative Strength to FTSE/JSE All Share
                                                                       index (J203)


      254                Profile’s Unit Trusts & Collective Investments March 2026
   251   252   253   254   255   256   257   258   259   260   261