
Page 253 - Profile's Unit Trusts & Collective Investments - March 2026
P. 253
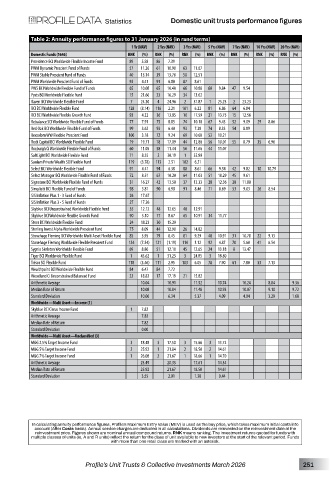
Statistics         Domestic unit trusts performance figures

          Table 2: Annuity performance figures to 31 January 2026 (in rand terms)
                                      1 Yr (NAV)  2 Yrs (NAV)  3 Yrs (NAV)  5 Yrs (NAV)  7 Yrs (NAV)  10 Yrs (NAV)  20 Yrs (NAV)
          Domestic Funds (1646)      RNK  (%)  RNK  (%)  RNK  (%)  RNK  (%)  RNK  (%)  RNK  (%)  RNK  (%)
          Providence BCI Worldwide Flexible Income Fund  89  5.58  86  7.39
          PWM Dynamic Prescient Fund of Funds  57  11.26  61  10.90  63  11.07
          PWM Stable Prescient Fund of Funds  40  15.14  39  13.70  50  12.51
          PWM Worldwide Prescient Fund of Funds  92  4.41  91  6.80  87  8.61
          PWS BCI Worldwide Flexible Fund of Funds  65  10.08  65  10.40  66  10.88  60  9.84  47  9.54
          Pyxis BCI Worldwide Flexible Fund  15  21.66  23  16.29  34  13.62
          Raven BCI Worldwide Flexible Fund  7  24.30  4  24.96  2  31.87  1  25.23  2  23.23
          RCI BCI Worldwide Flexible Fund  128  (8.14)  116  2.21  101  6.22  81  6.86  64  6.84
          RCI BCI Worldwide Flexible Growth Fund  93  4.32  36  13.85  10  17.59  21  13.75  15  12.56
          Rebalance SCI Worldwide Flexible Fund of Funds  77  7.91  75  8.85  74  10.10  67  9.43  52  9.09  29  8.06
          Red Oak BCI Worldwide Flexible Fund of Funds  99  3.62  93  6.40  93  7.38  74  8.33  54  8.89
          Rexsolom WW Flexible Prescient Fund  100  3.18  72  9.24  69  10.68  52  10.21
          Rock Capital BCI Worldwide Flexible Fund  19  19.71  18  17.09  44  12.80  56  10.01  55  8.79  35  6.96
          Roxburgh Ci Worldwide Flexible Fund of Funds  60  11.05  58  11.44  56  11.66  44  11.07
          SaltLight BCI Worldwide Flexible Fund  71  8.55  2  30.19  1  32.99
          Sanlam Private Wealth SCI Flexible Fund  119  (3.78)  113  2.51  102  6.21
          Select BCI Worldwide Flexible Fund  91  4.41  94  6.38  88  8.61  66  9.54  42  9.82  10  10.79
          Select Manager BCI Worldwide Flexible Fund of Funds  72  8.51  67  10.20  64  11.03  51  10.29  45  9.61
          Signature BCI Worldwide Flexible Fund of Funds  31  16.27  42  13.50  37  13.33  28  12.36  20  11.80
          Simplisiti BCI Flexible Fund of Funds  98  3.81  90  6.98  91  8.46  71  8.69  53  9.03  26  8.54
          SIS Inflation Plus 1 - 3 Fund of Funds  26  17.67
          SIS Inflation Plus 3 - 5 Fund of Funds  27  17.26
          Skyblue BCI Unconstrained Worldwide Flexible Fund  55  12.12  48  12.65  40  12.91
          Skyblue BCI Worldwide Flexible Growth Fund  90  5.10  77  8.67  65  10.91  34  11.77
          Steer BCI Worldwide Flexible Fund  24  18.23  30  15.29
          Sterling Invest Alpha Worldwide Prescient Fund  75  8.09  44  12.90  26  14.82
          Stonehage Fleming BCI Worldwide Multi Asset Flexible Fund  85  5.95  79  8.45  81  9.29  48  10.91  31  10.78  22  9.13
          Stonehage Fleming Worldwide Flexible Prescient Fund  124  (7.54)  121  (1.19)  114  3.12  92  4.87  70  5.60  41  6.54
          Sygnia Skeleton Worldwide Flexible Fund  69  8.80  51  12.10  45  12.65  24  13.18  8  13.47
          Tiger BCI Worldwide Flexible Fund  1  45.62  1  31.23  3  24.85  3  18.80
          Trésor SCI Flexible Fund    118  (3.46)  111  2.95  103  6.05  78  7.90  61  7.80  33  7.13
          Wealthpoint BCI Worldwide Flexible Fund  84  6.47  84  7.72
          Woodland Ci Unconstrained Balanced Fund  22  18.82  17  17.19  21  15.82
          Arithmetic Average             10.04   10.91  11.52  10.74  10.24  8.84   9.36
          Median Rate of Return          10.08   10.84  11.48  10.93  10.07  9.10   9.72
          Standard Deviation             10.06   6.34   5.37   4.09   4.04   3.29   1.68
          Worldwide—Multi Asset—Income (1)
          Skyblue BCI Cirrus Income Fund  1  7.82
          Arithmetic Average             7.82
          Median Rate of Return          7.82
          Standard Deviation             0.00
          Worldwide—Multi Asset—Unclassified (3)
          M&G 2.5% Target Income Fund  3  18.48  3  17.50  3  15.66  3  13.72
          M&G 5% Target Income Fund   2  25.92  1  21.84  2  18.50  2  14.61
          M&G 7% Target Income Fund   1  26.08  2  21.67  1  18.66  1  14.70
          Arithmetic Average             23.49   20.33  17.61  14.34
          Median Rate of Return          25.92   21.67  18.50  14.61
          Standard Deviation             3.55    2.01   1.38   0.44


          In calculating annuity performance figures, Profile’s Maximum Entry Value (MEV) is used as the buy price, which takes maximum initial costs into
           account (After Costs basis). Annual service charges are deducted in all calculations. Dividends are reinvested on the reinvestment date at the
           reinvestment price. Figures shown are nominal annual compound returns. RNK means ranking. The investment returns quoted for funds with
          multiple classes of units (ie, A and R units) reflect the return for the class of unit available to new investors at the start of the relevant period. Funds
                                 with more than one retail class are marked with an asterisk.

                         Profile’s Unit Trusts & Collective Investments March 2026     251