
Page 43 - Profile's Unit Trusts & Collective Investments - September 2025
P. 43
Basic concepts Chapter 2
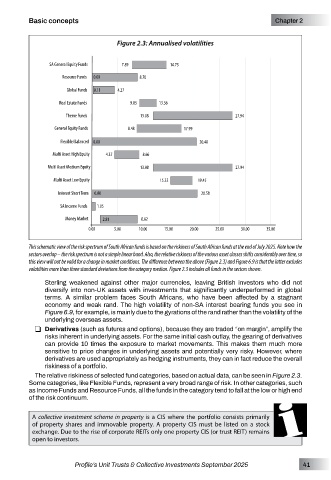
Figure 2.3: Annualised volatilities
This schematic view of the risk spectrum of South African funds is based on the riskiness of South African funds at the end of July 2025. Note how the
sectors overlap – the risk spectrum is not a simple linear band. Also, the relative riskiness of the various asset classes shifts considerably over time, so
this view will not be valid for a change in market conditions. The difference between the above (Figure 2.3) and Figure 6.9 is that the latter excludes
volatilities more than three standard deviations from the category median. Figure 2.3 includes all funds in the sectors shown.
Sterling weakened against other major currencies, leaving British investors who did not
diversify into non-UK assets with investments that significantly underperformed in global
terms. A similar problem faces South Africans, who have been affected by a stagnant
economy and weak rand. The high volatility of non-SA interest bearing funds you see in
Figure 6.9, for example, is mainly due to the gyrations of the rand rather than the volatility of the
underlying overseas assets.
R Derivatives (such as futures and options), because they are traded “on margin”, amplify the
risks inherent in underlying assets. For the same initial cash outlay, the gearing of derivatives
can provide 10 times the exposure to market movements. This makes them much more
sensitive to price changes in underlying assets and potentially very risky. However, where
derivatives are used appropriately as hedging instruments, they can in fact reduce the overall
riskiness of a portfolio.
The relative riskiness of selected fund categories, based on actual data, can be seen in Figure 2.3.
Some categories, like Flexible Funds, represent a very broad range of risk. In other categories, such
as Income Funds and Resource Funds, all the funds in the category tend to fall at the low or high end
of the risk continuum.
A collective investment scheme in property is a CIS where the portfolio consists primarily
of property shares and immovable property. A property CIS must be listed on a stock
exchange. Due to the rise of corporate REITs only one property CIS (or trust REIT) remains
open to investors.
Profile’s Unit Trusts & Collective Investments September 2025 41