
Page 72 - Profile's Unit Trusts & Collective Investments - March 2025
P. 72
CHAPTER 3
fund means that, to get the same return, an Chart 3.6: Different Types of Performance Tables
investor needed an interest rate of 10% per
ABC Up&Down Fund Over Last Three Years
annum (paid monthly in arrears). 60%
Absolute returns are harder to compare 45%
across different scenarios (eg, where 30%
calendar periods are not the same). For 15%
example, imagine adverts from two 0%
different funds, the one reporting 70% -15%
growth over 5 years, the other 41% growth 0 4 8 12 16 20 24 28 32 36
over 3 years. It’s not immediately obvious
Trailing Twelve Month Returns
which did better. Using CAGR we see that 3yrs ago 2yrs ago 1yr ago Today
the 70% growth is the equivalent of 11.2%
1yr to present (35.2%)
a year, 41% the equivalent of 12.1%,
making it clear which fund performed better 2yrs to present (29%, 13.6% p.a.)
on an annualised basis. (Of course, this
3yrs to present (47.3%, 11.8% p.a.)
comparison is not fair because the time
periods are different, but it illustrates why
Discrete Returns
CAGR can be easier to interpret.) 3yrs ago 2yrs ago 1yr ago Today
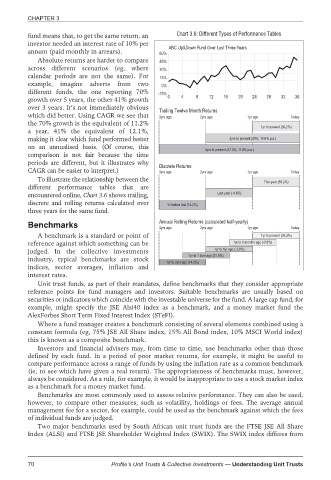
To illustrate the relationship between the
This year (35.2%)
different performance tables that are
encountered online, Chart 3.6 shows trailing, Last year (-4.6%)
discrete and rolling returns calculated over Yr before last (14.2%)
three years for the same fund.
Benchmarks Annual Rolling Returns (calculated half-yearly) 1yr ago Today
2yrs ago
3yrs ago
A benchmark is a standard or point of 1yr to present (35.2%)
reference against which something can be 1yr to 6 months ago (-3.6%)
judged. In the collective investments 1yr to 1yr ago (-3.6%)
1yr to 1.5yrs ago (31.9%)
industry, typical benchmarks are stock
1yr to 2yrs ago (14.2%)
indices, sector averages, inflation and
interest rates.
Unit trust funds, as part of their mandates, define benchmarks that they consider appropriate
reference points for fund managers and investors. Suitable benchmarks are usually based on
securities or indicators which coincide with the investable universe for the fund. A large cap fund, for
example, might specify the JSE Alsi40 index as a benchmark, and a money market fund the
AlexForbes Short Term Fixed Interest Index (STeFI).
Where a fund manager creates a benchmark consisting of several elements combined using a
constant formula (eg, 75% JSE All Share index, 15% All Bond index, 10% MSCI World index)
this is known as a composite benchmark.
Investors and financial advisers may, from time to time, use benchmarks other than those
defined by each fund. In a period of poor market returns, for example, it might be useful to
compare performance across a range of funds by using the inflation rate as a common benchmark
(ie, to see which have given a real return). The appropriateness of benchmarks must, however,
always be considered. As a rule, for example, it would be inappropriate to use a stock market index
as a benchmark for a money market fund.
Benchmarks are most commonly used to assess relative performance. They can also be used,
however, to compare other measures, such as volatility, holdings or fees. The average annual
management fee for a sector, for example, could be used as the benchmark against which the fees
of individual funds are judged.
Two major benchmarks used by South African unit trust funds are the FTSE JSE All Share
Index (ALSI) and FTSE JSE Shareholder Weighted Index (SWIX). The SWIX index differes from
70 Profile’s Unit Trusts & Collective Investments — Understanding Unit Trusts