
Page 54 - Profile's Unit Trusts & Collective Investments - March 2025
P. 54
CHAPTER 3
Chapter 3
Costs and Pricing
Costs and Pricing
NQF
Relevant to
The Importance of Costs 243130: 2
243135:1-3
Investors should never be blasé about the costs of investment management and 243141:1-4
administration. The fees paid to asset managers and fund administrators are a direct 243148: 2
charge against investment performance, and can have a significant impact on returns.
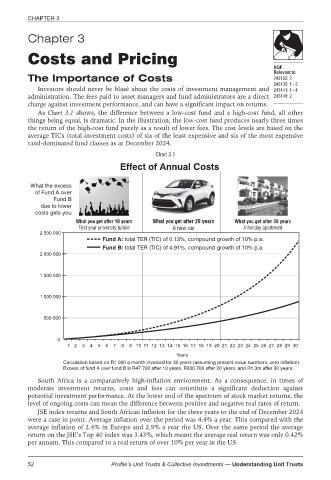
As Chart 3.1 shows, the difference between a low-cost fund and a high-cost fund, all other
things being equal, is dramatic. In the illustration, the low-cost fund produces nearly three times
the return of the high-cost fund purely as a result of lower fees. The cost levels are based on the
average TICs (total investment costs) of six of the least expensive and six of the most expensive
rand-dominated fund classes as at December 2024.
Chart 3.1
Effect of Annual Costs
What the excess
of Fund A over
Fund B
due to lower
costs gets you
What you get after 10 years What you get after 20 years What you get after 30 years
First year university tuition A new car A holiday apartment
2 500 000
Fund A: total TER (TIC) of 0.13%, compound growth of 10% p.a.
Fund B: total TER (TIC) of 4.91%, compound growth of 10% p.a.
2 000 000
1 500 000
1 000 000
500 000
0
1 2 3 4 5 6 7 8 9 10 11 12 13 14 15 16 17 18 19 20 21 22 23 24 25 26 27 28 29 30
Years
Calculation based on R1 000 a month invested for 30 years (assuming present value numbers, zero inflation).
Excess of fund A over fund B is R47 700 after 10 years, R330 700 after 20 years, and R1.3m after 30 years.
South Africa is a comparatively high-inflation environment. As a consequence, in times of
moderate investment returns, costs and fees can constitute a significant deduction against
potential investment performance. At the lower end of the spectrum of stock market returns, the
level of ongoing costs can mean the difference between positive and negative real rates of return.
JSE index returns and South African inflation for the three years to the end of December 2024
were a case in point. Average inflation over the period was 4.4% a year. This compared with the
average inflation of 2.4% in Europe and 2.9% a year the US. Over the same period the average
return on the JSE’s Top 40 index was 3.43%, which meant the average real return was only 0.42%
per annum. This compared to a real return of over 10% per year in the US.
52 Profile’s Unit Trusts & Collective Investments — Understanding Unit Trusts