
Page 245 - Profile's Unit Trusts & Collective Investments - March 2025
P. 245
Mazi NCIS Market Neutral Retail Hedge Fund
Mazi NCIS Market Neutral Retail Hedge Fund
Mazi NCIS Market Neutral Retail Hedge Fund
Sector: South African—Long Short
Equity—Market Neutral FUND EXPOSURE 31 DECEMBER 2024
Fund benchmark: STeFI Gross Exposure 36.37%
MANAGEMENT Net Equity Exposure 24.38%
Total Net Exposure 27.33%
Mazi Asset Management (Pty) Ltd.
Net Property Exposure 2.95%
FUND FOCUS Net Preference Shares Exposure 0.00%
The Market Neutral Fund is managed to
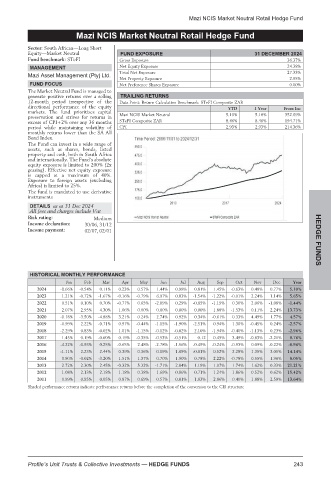
generate positive returns over a rolling TRAILING RETURNS
12-month period irrespective of the Data Point: Return Calculation Benchmark: STeFI Composite ZAR
directional performance of the equity YTD 1 Year From Inc
markets. The fund prioritizes capital
preservation and strives for returns in Mazi NCIS Market Neutral 5.10% 5.10% 352.09%
excess of CPI+2% over any 36 months STeFI Composite ZAR 8.46% 8.46% 194.71%
period while maintaining volatility of CPI 2.93% 2.93% 214.36%
monthly returns lower than the SA All
Bond Index.
The Fund can invest in a wide range of
assets, such as shares, bonds, listed
property and cash, both in South Africa
and internationally. The Fund’s absolute
equity exposure is limited to 200% (2x
gearing). Effective net equity exposure
is capped at a maximum of 40%.
Exposure to foreign assets (excluding
Africa) is limited to 25%.
The fund is mandated to use derivative
instruments
DETAILS as at 31 Dec 2024
All fees and charges include Vat
Risk rating: Medium
Income declaration: 30/06, 31/12
Income payment: 02/07, 02/01 HEDGE
HISTORICAL MONTHLY PERFORMANCE FUNDS
Jan Feb Mar Apr May Jun Jul Aug Sep Oct Nov Dec Year
2024 -0.66% -0.54% 0.11% 0.23% 0.57% 1.44% 0.98% 0.81% 1.45% -0.63% 0.48% 0.77% 5.10%
2023 1.21% -0.72% -1.67% -0.16% -0.79% 6.97% 0.03% -1.54% -1.22% -0.01% 2.24% 1.14% 5.65%
2022 0.51% 0.10% 0.70% -0.77% 0.65% -2.09% 0.29% -0.85% -1.19% 0.30% 2.06% -1.08% -1.44%
2021 2.07% 2.95% 4.30% 1.06% 0.00% 0.00% 0.00% 0.00% 1.88% -1.53% 0.11% 2.24% 13.73%
2020 -0.18% -3.50% -4.88% 3.21% 0.24% 2.74% 0.92% 0.34% -0.61% 0.33% 4.49% 1.77% 4.57%
2019 -0.99% 2.22% -0.71% 0.97% -0.44% -1.15% -1.90% -2.51% 0.94% 1.30% -0.45% 0.24% -2.57%
2018 -2.29% 0.83% -0.02% 1.01% -1.15% -0.12% -0.02% 2.10% -1.94% -0.40% -1.13% 0.23% -2.96%
2017 1.45% 0.19% -0.60% 0.19% -0.35% -0.53% -0.51% 0.12 0.45% 3.49% -0.83% -2.21% 0.76%
2016 -4.22% -0.93% 0.25% -0.65% 2.48% -2.78% -1.56% -0.49% -0.24% -0.93% 0.09% -0.22% -8.96%
2015 -1.11% 2.23% 2.44% 0.39% 0.36% 0.19% 1.69% -0.01% 0.52% 2.28% 1.35% 3.05% 14.14%
2014 0.90% -0.02% -3.20% 1.51% 1.37% 0.70% 1.90% 0.78% 2.22% -0.78% 0.55% 1.96% 8.05%
2013 2.72% 2.30% 2.45% -0.32% 5.32% -1.71% 2.84% 1.19% 1.07% 1.74% 1.62% 0.33% 21.21%
2012 1.08% 2.13% 2.18% 1.18% 0.38% 1.69% 0.86% 0.71% 1.24% 1.86% 0.52% 0.62% 15.42%
2011 0.99% 0.95% 0.05% 0.87% 0.69% 0.57% 0.01% 1.03% 2.86% 0.40% 1.88% 2.59% 13.64%
Shaded performance returns indicate perfromance returns before the completion of the conversion to the CIS structure
Profile’s Unit Trusts & Collective Investments — HEDGE FUNDS 243