
Page 241 - Profile's Unit Trusts & Collective Investments - March 2025
P. 241
Statistics Domestic Unit Trusts Performance Figures
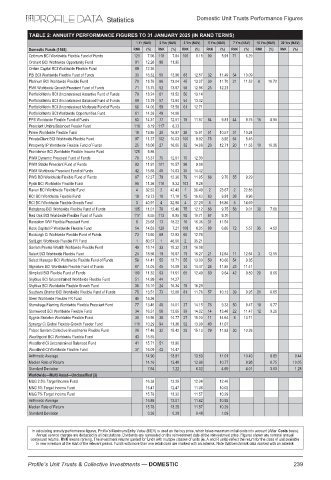
TABLE 2: ANNUITY PERFORMANCE FIGURES TO 31 JANUARY 2025 (IN RAND TERMS)
1 Yr (NAV) 2 Yrs (NAV) 3 Yrs (NAV) 5 Yrs (NAV) 7 Yrs (NAV) 10 Yrs (NAV) 20 Yrs (NAV)
Domestic Funds (1568) RNK (%) RNK (%) RNK (%) RNK (%) RNK (%) RNK (%) RNK (%)
Optimum BCI Worldwide Flexible Fund of Funds 121 7.96 118 7.64 106 8.18 90 5.91 71 6.29
Orchard BCI Worldwide Opportunity Fund 91 12.26 86 11.95
Ordian Capital BCI Worldwide Flexible Fund 89 12.36
PBi BCI Worldwide Flexible Fund of Funds 33 16.32 50 13.96 63 12.57 32 11.49 34 10.09
Platinum BCI Worldwide Flexible Fund 70 13.76 66 13.04 45 13.27 30 11.70 21 11.52 8 10.72
PMK Worldwide Growth Prescient Fund of Funds 71 13.75 52 13.87 56 12.96 25 12.21
PortfolioMetrix BCI Unconstrained Assertive Fund of Funds 79 13.24 61 13.52 50 13.14
PortfolioMetrix BCI Unconstrained Balanced Fund of Funds 69 13.79 57 13.64 54 13.02
PortfolioMetrix BCI Unconstrained Moderate Fund of Funds 66 14.06 59 13.58 61 12.71
PortfolioMetrix BCI Worldwide Opportunities Fund 61 14.38 49 14.00
PPS Worldwide Flexible Fund of Funds 63 14.31 77 12.51 78 11.97 64 9.81 44 9.75 15 8.95
Prescient Umbra Balanced Feeder Fund 118 8.19 117 8.33
Prime Worldwide Flexible Fund 18 19.85 20 16.87 26 15.61 51 10.57 31 10.24
PrivateClient BCI Worldwide Flexible Fund 97 11.37 102 10.03 100 9.82 78 8.92 64 8.46
Prosperity IP Worldwide Flexible Fund of Funds 25 18.06 27 16.05 32 14.68 20 12.71 20 11.53 10 10.36
Providence BCI Worldwide Flexible Income Fund 125 5.86
PWM Dynamic Prescient Fund of Funds 78 13.37 75 12.61 70 12.30
PWM Stable Prescient Fund of Funds 93 11.91 101 10.57 98 9.98
PWM Worldwide Prescient Fund of Funds 42 15.68 40 14.63 35 14.42
PWS BCI Worldwide Flexible Fund of Funds 87 12.37 79 12.36 79 11.95 68 9.70 55 9.29
Pyxis BCI Worldwide Flexible Fund 98 11.36 110 9.32 103 9.28
Raven BCI Worldwide Flexible Fund 4 32.52 2 42.43 1 36.49 2 23.67 2 22.85
RCI BCI Worldwide Flexible Fund 19 19.73 18 17.18 15 16.63 63 9.91 38 9.96
RCI BCI Worldwide Flexible Growth Fund 3 40.91 4 32.98 4 27.29 5 15.86 5 14.69
Rebalance BCI Worldwide Flexible Fund of Funds 105 11.01 78 12.40 75 12.12 66 9.75 58 9.01 30 7.68
Red Oak BCI Worldwide Flexible Fund of Funds 117 8.55 113 8.95 92 10.71 67 9.70
Rexsolom WW Flexible Prescient Fund 8 23.68 13 18.22 16 16.36 31 11.54
Rock Capital IP Worldwide Flexible Fund 54 14.63 120 7.21 108 6.35 89 6.65 72 5.57 35 4.50
Roxburgh Ci Worldwide Flexible Fund of Funds 73 13.60 69 12.93 60 12.74
SaltLight Worldwide Flexible FR Fund 1 60.57 1 46.60 2 35.21
Sanlam Private Wealth Worldwide Flexible Fund 49 15.14 33 15.32 21 16.08
Select BCI Worldwide Flexible Fund 24 18.56 19 16.87 19 16.27 21 12.64 11 12.64 3 12.55
Select Manager BCI Worldwide Flexible Fund of Funds 58 14.41 55 13.71 55 13.00 50 10.60 54 9.35
Signature BCI Worldwide Flexible Fund of Funds 67 14.05 45 14.09 34 14.47 28 11.85 23 11.41
Simplisiti BCI Flexible Fund of Funds 100 11.32 93 11.61 65 12.49 69 9.64 42 9.89 20 8.66
Skyblue BCI Unconstrained Worldwide Flexible Fund 51 14.99 44 14.27
Skyblue BCI Worldwide Flexible Growth Fund 36 16.10 24 16.34 18 16.29
Southern Charter BCI Worldwide Flexible Fund of Funds 75 13.51 73 12.68 81 11.78 57 10.13 39 9.95 21 8.65
Steer Worldwide Flexible FR Fund 45 15.36
Stonehage Fleming Worldwide Flexible Prescient Fund 77 13.46 48 14.01 37 14.15 76 9.33 50 9.47 18 8.77
Stonewood BCI Worldwide Flexible Fund 34 16.31 56 13.65 39 14.02 14 13.46 22 11.47 12 9.26
Sygnia Skeleton Worldwide Flexible Fund 30 16.56 38 14.77 27 15.20 11 14.64 8 13.71
Synergy Ci Global Flexible Growth Feeder Fund 111 10.29 94 11.36 52 13.09 40 11.07
Trésor Sanlam Collective Investments Flexible Fund 26 17.46 32 15.42 29 15.13 29 11.83 30 10.26
Wealthpoint BCI Worldwide Flexible Fund 43 15.55
Woodland Ci Unconstrained Balanced Fund 41 15.71 51 13.90
Woodland Ci Worldwide Flexible Fund 37 16.09 42 14.47
Arithmetic Average 14.96 13.81 13.53 11.01 10.40 8.85 9.44
Median Rate of Return 14.16 13.48 12.98 10.77 9.98 8.75 10.05
Standard Deviation 7.64 7.22 6.02 4.69 4.01 3.63 1.28
Worldwide—Multi Asset—Unclassified (3)
M&G 2.5% Target Income Fund 16.38 13.25 12.24 12.46
M&G 5% Target Income Fund 15.47 12.47 11.06 10.02
M&G 7% Target Income Fund 15.78 13.32 11.57 10.29
Arithmetic Average 15.88 13.01 11.62 10.92
Median Rate of Return 15.78 13.25 11.57 10.29
Standard Deviation 0.38 0.39 0.48 1.09
In calculating annuity performance figures, Profile's Maximum Entry Value (MEV) is used as the buy price, which takes maximum initial costs into account (After Costs basis).
Annual service charges are deducted in all calculations. Dividends are reinvested on the reinvestment date at the reinvestment price. Figures shown are nominal annual
compound returns. RNK means ranking. The investment returns quoted for funds with multiple classes of units (ie, A and R units) reflect the return for the class of unit available
to new investors at the start of the relevant period. Funds with more than one retail class are marked with an asterisk. Note that benchmark data marked with an asterisk
Profile’s Unit Trusts & Collective Investments — DOMESTIC 239