
Page 119 - Profile's Unit Trusts & Collective Investments - March 2025
P. 119
Investment Risk
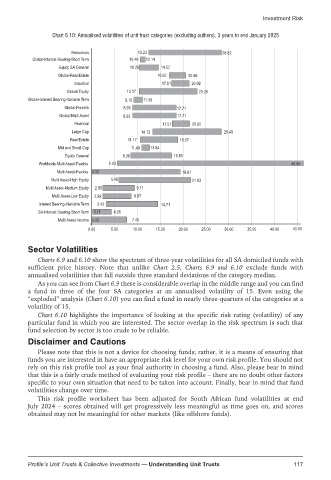
Chart 6.10: Annualised volatilities of unit trust categories (excluding outliers), 3 years to end January 2025
Resources 13.23 28.82
Global-Interest Bearing-Short Term 10.40 12.14
Equity SA General 10.29 14.57
Global-Real Estate 16.62 20.86
Industrial 17.51 20.92
Global-Equity 10.17 23.26
Global-Interest Bearing-Variable Term 9.19 11.39
Global-Flexible 8.93 17.71
Global-Multi Asset 8.93 17.71
Financial 17.51 20.92
Large Cap 14.12 28.49
Real Estate 11.17 18.17
Mid and Small Cap 11.49 13.84
Equity General 8.36 16.80
Worldwide-Multi Asset-Flexible 5.03 46.65
Multi Asset-Flexible 0.00 19.61
Multi Asset-High Equity 5.46 21.83
Multi Asset-Medium Equity 2.99 9.11
Multi Asset-Low Equity 2.99 8.87
Interest Bearing-Viariable Term 3.42 14.71
SA-Interest Bearing-Short Term 0.11 4.06
Multi Asset-Income 0.00 7.45
0.00 5.00 10.00 15.00 20.00 25.00 30.00 35.00 40.00 45.00
Sector Volatilities
Charts 6.9 and 6.10 show the spectrum of three-year volatilities for all SA domiciled funds with
sufficient price history. Note that unlike Chart 2.5, Charts 6.9 and 6.10 exclude funds with
annualised volatilities that fall outside three standard deviations of the category median.
As you can see from Chart 6.9 there is considerable overlap in the middle range and you can find
a fund in three of the four SA categories at an annualised volatility of 15. Even using the
“exploded” analysis (Chart 6.10) you can find a fund in nearly three-quarters of the categories at a
volatility of 15.
Chart 6.10 highlights the importance of looking at the specific risk rating (volatility) of any
particular fund in which you are interested. The sector overlap in the risk spectrum is such that
fund selection by sector is too crude to be reliable.
Disclaimer and Cautions
Please note that this is not a device for choosing funds; rather, it is a means of ensuring that
funds you are interested in have an appropriate risk level for your own risk profile. You should not
rely on this risk profile tool as your final authority in choosing a fund. Also, please bear in mind
that this is a fairly crude method of evaluating your risk profile – there are no doubt other factors
specific to your own situation that need to be taken into account. Finally, bear in mind that fund
volatilities change over time.
This risk profile worksheet has been adjusted for South African fund volatilities at end
July 2024 – scores obtained will get progressively less meaningful as time goes on, and scores
obtained may not be meaningful for other markets (like offshore funds).
Profile’s Unit Trusts & Collective Investments — Understanding Unit Trusts 117