
Page 114 - Profiles's Unit Trusts & Collective Investments - September 2024
P. 114
CHAPTER 6
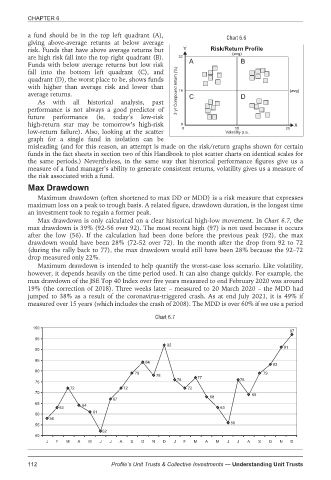
a fund should be in the top left quadrant (A), Chart 6.6
giving above-average returns at below average
risk. Funds that have above average returns but Y Risk/Return Profile
(avg)
are high risk fall into the top right quadrant (B). 32
Funds with below average returns but low risk A B
fall into the bottom left quadrant (C), and
quadrant (D), the worst place to be, shows funds
with higher than average risk and lower than 3 yr Compound return (%) 16 (avg)
average returns. C D
As with all historical analysis, past
performance is not always a good predictor of
future performance (ie, today’s low-risk
high-return star may be tomorrow’s high-risk 0 X
0 10 20
low-return failure). Also, looking at the scatter Volatility p.a.
graph for a single fund in isolation can be
misleading (and for this reason, an attempt is made on the risk/return graphs shown for certain
funds in the fact sheets in section two of this Handbook to plot scatter charts on identical scales for
the same periods.) Nevertheless, in the same way that historical performance figures give us a
measure of a fund manager’s ability to generate consistent returns, volatility gives us a measure of
the risk associated with a fund.
Max Drawdown
Maximum drawdown (often shortened to max DD or MDD) is a risk measure that expresses
maximum loss on a peak to trough basis. A related figure, drawdown duration, is the longest time
an investment took to regain a former peak.
Max drawdown is only calculated on a clear historical high-low movement. In Chart 6.7, the
max drawdown is 39% (92-56 over 92). The most recent high (97) is not used because it occurs
after the low (56). If the calculation had been done before the previous peak (92), the max
drawdown would have been 28% (72-52 over 72). In the month after the drop from 92 to 72
(during the rally back to 77), the max drawdown would still have been 28% because the 92–72
drop measured only 22%.
Maximum drawdown is intended to help quantify the worst-case loss scenario. Like volatility,
however, it depends heavily on the time period used. It can also change quickly. For example, the
max drawdown of the JSE Top 40 Index over five years measured to end February 2020 was around
19% (the correction of 2018). Three weeks later – measured to 20 March 2020 – the MDD had
jumped to 38% as a result of the coronavirus-triggered crash. As at end July 2021, it is 49% if
measured over 15 years (which includes the crash of 2008). The MDD is over 60% if we use a period
Chart 6.7
100
97
95
92
90 91
85 84
83
80
79 79
78 77
76 76
75
72 72 72
70 69
68
67
65 64
63 63
61
60
58
56
55
52
50
J F M A M J J A S O N D J F M A M J J A S O N D
112 Profile’s Unit Trusts & Collective Investments — Understanding Unit Trusts