
Page 112 - Profiles's Unit Trusts & Collective Investments - September 2024
P. 112
CHAPTER 6
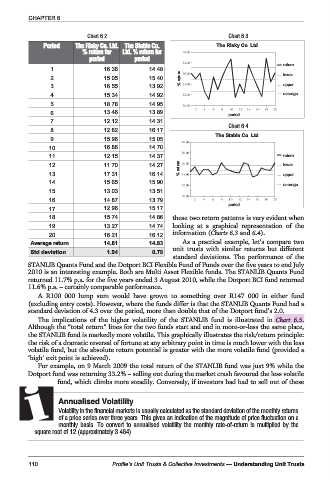
Chart 6.2 Chart 6.3
Period The Risky Co. Ltd. TheStableCo. The Risky Co. Ltd
%returnfor Ltd. % return for
period period
return
1 16.36 14.48
2 15.05 15.40 % return lower
3 16.55 13.92 upper
4 15.34 14.92 average
5 18.78 14.95
6 13.46 13.89 period
7 12.12 14.31
Chart 6.4
8 12.82 16.17
The Stable Co. Ltd
9 15.96 15.05
10 16.86 14.70
11 12.15 14.37 return
12 11.70 14.27 % return lower
13 17.31 16.14 upper
14 15.65 15.90 average
15 13.03 13.51
16 14.87 13.79
period
17 12.96 15.17
18 15.74 14.86 these two return patterns is very evident when
19 13.27 14.74 looking at a graphical representation of the
20 16.21 16.12 information (Charts 6.3 and 6.4).
Average return 14.81 14.83 As a practical example, let’s compare two
unit trusts with similar returns but different
Std deviation 1.94 0.79
standard deviations. The performance of the
STANLIB Quants Fund and the Dotport BCI Flexible Fund of Funds over the five years to end July
2010 is an interesting example. Both are Multi Asset Flexible funds. The STANLIB Quants Fund
returned 11.7% p.a. for the five years ended 3 August 2010, while the Dotport BCI fund returned
11.6% p.a. – certainly comparable performance.
A R100 000 lump sum would have grown to something over R147 000 in either fund
(excluding entry costs). However, where the funds differ is that the STANLIB Quants Fund had a
standard deviation of 4.3 over the period, more than double that of the Dotport fund’s 2.0.
The implications of the higher volatility of the STANLIB fund is illustrated in Chart 6.5.
Although the “total return” lines for the two funds start and end in more-or-less the same place,
the STANLIB fund is markedly more volatile. This graphically illustrates the risk/return principle:
the risk of a dramatic reversal of fortune at any arbitrary point in time is much lower with the less
volatile fund, but the absolute return potential is greater with the more volatile fund (provided a
‘high’ exit point is achieved).
For example, on 9 March 2009 the total return of the STANLIB fund was just 9% while the
Dotport fund was returning 33.2% – selling out during the market crash favoured the less volatile
fund, which climbs more steadily. Conversely, if investors had had to sell out of these
Annualised Volatility
Volatility in the financial markets is usually calculated as the standard deviation of the monthly returns
of a price series over three years. This gives an indication of the magnitude of price fluctuation on a
monthly basis. To convert to annualised volatility the monthly rate-of-return is multiplied by the
square root of 12 (approximately 3.464).
110 Profile’s Unit Trusts & Collective Investments — Understanding Unit Trusts