
Page 221 - Profile's Unit Trusts & Collective Investments - March 2026
P. 221
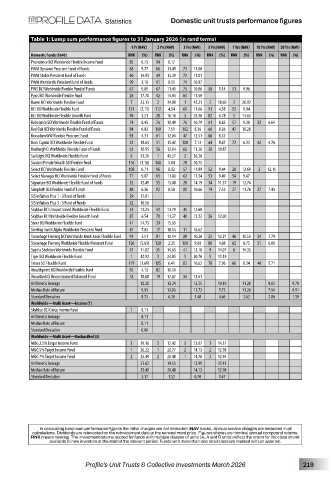
Statistics         Domestic unit trusts performance figures

          Table 1: Lump sum performance figures to 31 January 2026 (in rand terms)
                                      1 Yr (NAV)  2 Yrs (NAV)  3 Yrs (NAV)  5 Yrs (NAV)  7 Yrs (NAV)  10 Yrs (NAV)  20 Yrs (NAV)
          Domestic Funds (1646)      RNK  (%)  RNK  (%)  RNK  (%)  RNK  (%)  RNK  (%)  RNK  (%)  RNK  (%)
          Providence BCI Worldwide Flexible Income Fund  85  6.73  94  8.17
          PWM Dynamic Prescient Fund of Funds  68  9.77  66  11.49  73  11.00
          PWM Stable Prescient Fund of Funds  40  14.93  49  13.39  72  11.01
          PWM Worldwide Prescient Fund of Funds  99  3.18  91  8.51  74  10.97
          PWS BCI Worldwide Flexible Fund of Funds  67  9.89  67  11.41  75  10.86  58  9.14  51  9.98
          Pyxis BCI Worldwide Flexible Fund  26  17.70  42  14.04  63  11.50
          Raven BCI Worldwide Flexible Fund  7  23.13  2  34.08  1  45.21  2  18.60  2  26.92
          RCI BCI Worldwide Flexible Fund  121  (2.15)  112  4.54  60  11.66  91  4.58  52  9.94
          RCI BCI Worldwide Flexible Growth Fund  98  3.21  28  16.16  3  23.38  82  6.78  5  14.65
          Rebalance SCI Worldwide Flexible Fund of Funds  74  8.45  76  10.49  76  10.79  61  8.85  57  9.30  33  6.64
          Red Oak BCI Worldwide Flexible Fund of Funds  84  6.83  100  7.51  102  8.36  66  8.36  47  10.28
          Rexsolom WW Flexible Prescient Fund  93  4.31  61  12.04  47  12.51  68  8.32
          Rock Capital BCI Worldwide Flexible Fund  22  18.63  31  15.42  108  7.13  64  8.67  72  6.33  42  4.76
          Roxburgh Ci Worldwide Flexible Fund of Funds  61  10.95  56  12.84  66  11.28  38  10.87
          SaltLight BCI Worldwide Flexible Fund  6  23.20  1  45.57  2  36.28
          Sanlam Private Wealth SCI Flexible Fund  116  (1.16)  108  5.84  78  10.75
          Select BCI Worldwide Flexible Fund  108  0.71  96  8.02  57  11.99  52  9.44  20  12.69  2  12.15
          Select Manager BCI Worldwide Flexible Fund of Funds  71  9.07  63  11.80  62  11.54  51  9.49  54  9.47
          Signature BCI Worldwide Flexible Fund of Funds  52  12.49  55  13.08  28  14.19  34  11.37  19  12.74
          Simplisiti BCI Flexible Fund of Funds  88  6.36  92  8.50  80  10.66  74  7.52  27  11.76  27  7.43
          SIS Inflation Plus 1 - 3 Fund of Funds  29  17.01
          SIS Inflation Plus 3 - 5 Fund of Funds  32  16.56
          Skyblue BCI Unconstrained Worldwide Flexible Fund  53  12.25  43  13.79  45  12.60
          Skyblue BCI Worldwide Flexible Growth Fund  87  6.54  70  11.27  40  13.22  26  12.00
          Steer BCI Worldwide Flexible Fund  41  14.75  29  15.65
          Sterling Invest Alpha Worldwide Prescient Fund  81  7.03  17  18.14  11  16.62
          Stonehage Fleming BCI Worldwide Multi Asset Flexible Fund  91  5.51  81  10.14  88  10.20  25  12.21  46  10.53  24  7.79
          Stonehage Fleming Worldwide Flexible Prescient Fund  126  (5.65)  120  2.31  100  9.00  90  4.68  62  8.75  31  6.80
          Sygnia Skeleton Worldwide Flexible Fund  57  11.82  35  14.63  41  13.18  9  14.07  6  14.35
          Tiger BCI Worldwide Flexible Fund  1  42.92  3  24.05  5  20.70  5  15.19
          Trésor SCI Flexible Fund    119  (1.69)  105  6.41  82  10.62  70  7.96  66  8.34  40  5.71
          Wealthpoint BCI Worldwide Flexible Fund  95  4.13  82  10.10
          Woodland Ci Unconstrained Balanced Fund  18  18.68  19  17.87  34  13.61
          Arithmetic Average             10.20   12.34  12.35  10.10  11.28  8.03   9.70
          Median Rate of Return          9.93    12.03  11.73  9.73   11.26  7.94   9.91
          Standard Deviation             8.73    6.20   5.40   4.66   3.62   2.86   1.59
          Worldwide—Multi Asset—Income (1)
          Skyblue BCI Cirrus Income Fund  1  8.11
          Arithmetic Average             8.11
          Median Rate of Return          8.11
          Standard Deviation             0.00
          Worldwide—Multi Asset—Unclassified (3)
          M&G 2.5% Target Income Fund  3  19.16  3  17.42  3  13.07  1  14.37
          M&G 5% Target Income Fund   1  26.22  1  20.77  2  14.13  2  12.98
          M&G 7% Target Income Fund   2  25.49  2  20.48  1  14.78  3  12.94
          Arithmetic Average             23.62   19.55  13.99  13.43
          Median Rate of Return          25.49   20.48  14.13  12.98
          Standard Deviation             3.17    1.52   0.70   0.67


             In calculating lump sum performance figures the initial charges are not deducted (NAV basis). Annual service charges are deducted in all
          calculations. Dividends are reinvested on the reinvestment date at the reinvestment price. Figures shown are nominal annual compound returns.
          RNK means ranking. The investment returns quoted for funds with multiple classes of units (ie, A and R units) reflect the return for the class of unit
               available to new investors at the start of the relevant period. Funds with more than one retail class are marked with an asterisk.


                         Profile’s Unit Trusts & Collective Investments March 2026     219