
Page 212 - Profile's Unit Trusts & Collective Investments - March 2026
P. 212
Domestic unit trusts performance figures Statistics
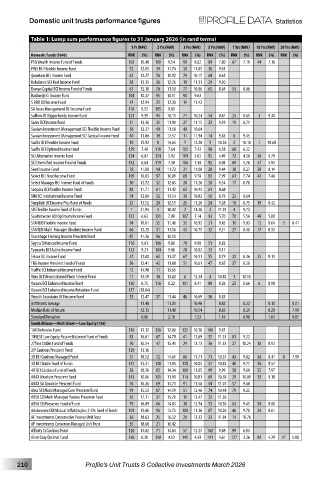
Table 1: Lump sum performance figures to 31 January 2026 (in rand terms)
1 Yr (NAV) 2 Yrs (NAV) 3 Yrs (NAV) 5 Yrs (NAV) 7 Yrs (NAV) 10 Yrs (NAV) 20 Yrs (NAV)
Domestic Funds (1646) RNK (%) RNK (%) RNK (%) RNK (%) RNK (%) RNK (%) RNK (%)
PSG Wealth Income Fund of Funds 102 10.48 109 9.54 99 9.02 84 7.80 67 7.19 44 7.16
PWS BCI Flexible Income Fund 72 12.05 39 11.74 30 11.05 38 9.03
Quantum BCI Income Fund 62 12.27 76 10.92 74 10.17 64 8.65
Rebalance SCI Real Income Fund 38 13.15 26 12.26 19 11.31 29 9.30
Rowan Capital BCI Income Fund of Funds 67 12.18 70 11.10 77 10.08 65 8.64 53 8.00
Roxburgh Ci Income Fund 104 10.37 95 10.11 90 9.63
S BRO BCI Income Fund 41 12.94 23 12.30 14 11.42
SA Asset Management BCI Income Fund 118 9.52 105 9.81
Saffron BCI Opportunity Income Fund 121 9.39 94 10.11 71 10.24 54 8.81 24 8.65 3 9.30
Salvo BCI Income Fund 31 13.36 35 11.90 27 11.15 23 9.39 19 8.71
Sanlam Investment Management SCI Flexible Income Fund 58 12.37 49 11.58 49 10.64
Sanlam Investment Management SCI Tactical Income Fund 40 13.06 19 12.57 11 11.94 14 9.63 6 9.45
Sasfin BCI Flexible Income Fund 10 15.92 8 14.63 7 12.20 5 10.36 2 10.10 1 10.68
Sasfin BCI Optimal Income Fund 129 7.48 118 7.64 103 7.43 90 6.58 68 6.22
SCI Alternative Income Fund 134 6.07 124 5.92 109 5.62 95 4.49 72 4.50 50 4.79
SCI Diversified Income Fund of Funds 132 6.64 119 7.30 106 7.30 92 6.03 69 5.78 47 5.95
Seed Income Fund 78 11.80 40 11.72 31 11.00 20 9.44 38 8.27 30 8.14
Select BCI Fixed Income Fund 109 10.03 97 10.09 88 9.74 82 7.99 61 7.74 43 7.46
Select Manager BCI Income Fund of Funds 50 12.72 32 12.03 24 11.20 28 9.34 17 8.78
Sequoia BCI Flexible Income Fund 83 11.71 61 11.42 63 10.43 61 8.68
SIM SCI Institutional Income Fund 74 12.00 52 11.54 39 10.82 58 8.79 25 8.64
Simplisiti BCI Income Plus Fund of Funds 27 13.52 20 12.51 25 11.20 24 9.38 18 8.75 19 8.42
SIS Flexible Income Fund of Funds 1 21.94 4 18.42 2 14.48 2 11.93 4 9.73
Southchester BCI Optimum Income Fund 133 6.63 121 7.08 107 7.14 93 5.70 70 5.56 48 5.80
STANLIB Flexible Income Fund 94 10.81 55 11.46 35 10.92 21 9.42 10 9.03 12 8.64 5 8.41
STANLIB Multi-Manager Absolute Income Fund 66 12.20 51 11.56 43 10.75 32 9.21 27 8.48 17 8.53
Stonehage Fleming Income Prescient Fund 87 11.36 96 10.10
Sygnia Enhanced Income Fund 116 9.61 106 9.80 79 9.98 51 8.82
Taquanta BCI Active Income Fund 123 9.21 104 9.86 78 10.02 33 9.17
Trésor SCI Income Fund 47 12.80 64 11.37 67 10.31 55 8.79 32 8.36 32 8.13
TRG Income Prescient Fund of Funds 56 12.41 42 11.68 51 10.61 47 8.85 37 8.28
Truffle SCI Enhanced Income Fund 12 14.98 11 13.63
Visio BCI Unconstrained Fixed Interest Fund 17 14.59 10 13.82 6 12.34 4 10.82 1 10.13
Vunani BCI Enhanced Income Fund 130 6.75 116 8.22 101 8.41 80 8.26 23 8.66 6 8.98
Vunani BCI Enhanced Income Retention Fund 137 (58.04)
Wealth Associates BCI Income Fund 55 12.47 57 11.44 46 10.69 50 8.83
Arithmetic Average 11.48 11.31 10.40 8.82 8.22 8.10 8.01
Median Rate of Return 12.13 11.40 10.54 8.85 8.29 8.29 7.99
Standard Deviation 6.86 2.18 1.53 1.16 0.98 1.04 0.87
South African—Multi Asset—Low Equity (156)
10X Defensive Fund 130 13.12 126 12.00 122 10.38 106 9.83
1NVEST Low Equity Passive Balanced Fund of Funds 83 16.01 67 14.78 41 12.69 35 11.33 81 9.22
27four Stable Fund of Funds 70 16.54 47 15.41 24 13.13 36 11.33 27 10.24 16 8.92
2IP Cautious Prescient Fund 129 13.16
3B BCI Cautious Managed Fund 37 18.52 72 14.61 86 11.71 71 10.57 43 9.82 30 8.41 8 7.99
3B BCI Stable Fund of Funds 127 13.31 128 11.95 128 10.05 57 10.85 48 9.77 26 8.57
4D BCI Cautious Fund of Funds 38 18.26 83 14.34 109 11.05 99 9.99 58 9.60 52 7.97
ABAX Absolute Prescient Fund 143 10.86 131 11.90 114 10.81 69 10.58 29 10.09 13 9.18
ABAX SA Absolute Prescient Fund 76 16.26 69 14.71 91 11.58 44 11.07 57 9.60
Absa SCI Multi Managed Core Preserver Fund 91 15.53 87 14.19 51 12.46 74 10.48 79 9.25
ABSA SCI Multi Managed Passive Preserver Fund 55 17.11 37 15.76 15 13.47 33 11.36
ABSA SCI Preserver Fund of Fund 79 16.09 66 14.83 38 12.74 73 10.56 63 9.45 50 8.00
Adviceworx Old Mutual Inflation plus 2-3% Fund of Funds 101 15.06 96 13.73 100 11.36 87 10.26 46 9.78 24 8.61
AF Investments Conservative Passive Unit Trust 36 18.63 25 16.32 20 13.32 23 11.84 14 10.76
AF Investments Conserver Managed Unit Trust 35 18.68 21 16.42
Affinity Ci Cautious Fund 120 14.02 71 14.64 57 12.27 102 9.88 99 8.83
Allan Gray Optimal Fund 156 0.30 150 4.52 145 4.59 141 4.61 127 3.36 89 4.29 17 5.88
210 Profile’s Unit Trusts & Collective Investments March 2026