
Page 72 - Profile's Unit Trusts & Collective Investments - September 2025
P. 72
Chapter 3 Costs and pricing
are designed to achieve this, but advisers
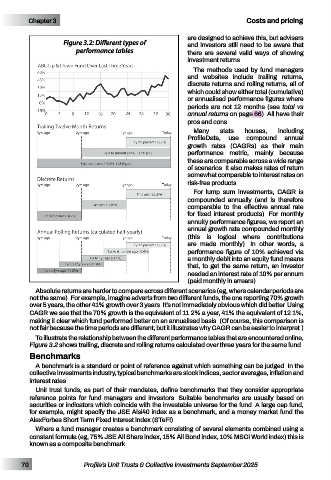
Figure 3.2: Different types of and investors still need to be aware that
performance tables there are several valid ways of showing
investment returns.
The methods used by fund managers
and websites include trailing returns,
discrete returns and rolling returns, all of
which could show either total (cumulative)
or annualised performance figures where
periods are not 12 months (see total vs
annual returns on page 66). All have their
pros and cons.
Many stats houses, including
ProfileData, use compound annual
growth rates (CAGRs) as their main
performance metric, mainly because
these are comparable across a wide range
of scenarios. It also makes rates of return
somewhat comparable to interest rates on
risk-free products.
For lump sum investments, CAGR is
compounded annually (and is therefore
comparable to the effective annual rate
for fixed interest products). For monthly
annuity performance figures, we report an
annual growth rate compounded monthly
(this is logical where contributions
are made monthly). In other words, a
performance figure of 10% achieved via
a monthly debit into an equity fund means
that, to get the same return, an investor
needed an interest rate of 10% per annum
(paid monthly in arrears).
Absolute returns are harder to compare across different scenarios (eg, where calendar periods are
not the same). For example, imagine adverts from two different funds, the one reporting 70% growth
over 5 years, the other 41% growth over 3 years. It’s not immediately obvious which did better. Using
CAGR we see that the 70% growth is the equivalent of 11.2% a year, 41% the equivalent of 12.1%,
making it clear which fund performed better on an annualised basis. (Of course, this comparison is
not fair because the time periods are different, but it illustrates why CAGR can be easier to interpret.)
To illustrate the relationship between the different performance tables that are encountered online,
Figure 3.2 shows trailing, discrete and rolling returns calculated over three years for the same fund.
Benchmarks
A benchmark is a standard or point of reference against which something can be judged. In the
collective investments industry, typical benchmarks are stock indices, sector averages, inflation and
interest rates.
Unit trust funds, as part of their mandates, define benchmarks that they consider appropriate
reference points for fund managers and investors. Suitable benchmarks are usually based on
securities or indicators which coincide with the investable universe for the fund. A large cap fund,
for example, might specify the JSE Alsi40 index as a benchmark, and a money market fund the
AlexForbes Short Term Fixed Interest Index (STeFI).
Where a fund manager creates a benchmark consisting of several elements combined using a
constant formula (eg, 75% JSE All Share index, 15% All Bond index, 10% MSCI World index) this is
known as a composite benchmark.
70 Profile’s Unit Trusts & Collective Investments September 2025