
Page 38 - Profile's Unit Trusts & Collective Investments - March 2025
P. 38
CHAPTER 2
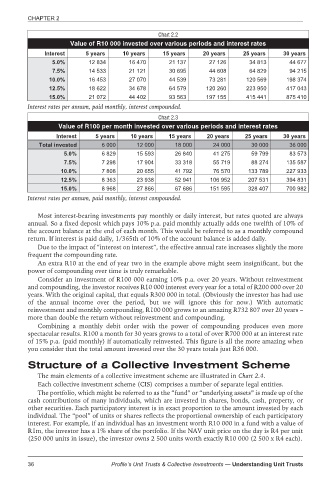
Chart 2.2
Value of R10 000 invested over various periods and interest rates
Interest 5 years 10 years 15 years 20 years 25 years 30 years
5.0% 12 834 16 470 21 137 27 126 34 813 44 677
7.5% 14 533 21 121 30 695 44 608 64 829 94 215
10.0% 16 453 27 070 44 539 73 281 120 569 198 374
12.5% 18 622 34 678 64 579 120 260 223 950 417 043
15.0% 21 072 44 402 93 563 197 155 415 441 875 410
Interest rates per annum, paid monthly, interest compounded.
Chart 2.3
Value of R100 per month invested over various periods and interest rates
Interest 5 years 10 years 15 years 20 years 25 years 30 years
Total invested 6 000 12 000 18 000 24 000 30 000 36 000
5.0% 6 829 15 593 26 840 41 275 59 799 83 573
7.5% 7 298 17 904 33 318 55 719 88 274 135 587
10.0% 7 808 20 655 41 792 76 570 133 789 227 933
12.5% 8 363 23 938 52 941 106 952 207 531 394 831
15.0% 8 968 27 866 67 686 151 595 328 407 700 982
Interest rates per annum, paid monthly, interest compounded.
Most interest-bearing investments pay monthly or daily interest, but rates quoted are always
annual. So a fixed deposit which pays 10% p.a. paid monthly actually adds one twelfth of 10% of
the account balance at the end of each month. This would be referred to as a monthly compound
return. If interest is paid daily, 1/365th of 10% of the account balance is added daily.
Due to the impact of “interest on interest”, the effective annual rate increases slightly the more
frequent the compounding rate.
An extra R10 at the end of year two in the example above might seem insignificant, but the
power of compounding over time is truly remarkable.
Consider an investment of R100 000 earning 10% p.a. over 20 years. Without reinvestment
and compounding, the investor receives R10 000 interest every year for a total of R200 000 over 20
years. With the original capital, that equals R300 000 in total. (Obviously the investor has had use
of the annual income over the period, but we will ignore this for now.) With automatic
reinvestment and monthly compounding, R100 000 grows to an amazing R732 807 over 20 years –
more than double the return without reinvestment and compounding.
Combining a monthly debit order with the power of compounding produces even more
spectacular results. R100 a month for 30 years grows to a total of over R700 000 at an interest rate
of 15% p.a. (paid monthly) if automatically reinvested. This figure is all the more amazing when
you consider that the total amount invested over the 30 years totals just R36 000.
Structure of a Collective Investment Scheme
The main elements of a collective investment scheme are illustrated in Chart 2.4.
Each collective investment scheme (CIS) comprises a number of separate legal entities.
The portfolio, which might be referred to as the “fund” or “underlying assets” is made up of the
cash contributions of many individuals, which are invested in shares, bonds, cash, property, or
other securities. Each participatory interest is in exact proportion to the amount invested by each
individual. The “pool” of units or shares reflects the proportional ownership of each participatory
interest. For example, if an individual has an investment worth R10 000 in a fund with a value of
R1m, the investor has a 1% share of the portfolio. If the NAV unit price on the day is R4 per unit
(250 000 units in issue), the investor owns 2 500 units worth exactly R10 000 (2 500 x R4 each).
36 Profile’s Unit Trusts & Collective Investments — Understanding Unit Trusts